
Responses to a few questions
Jun 11, 2025Hopefully, in the coming days, there will be a box allowing you to comment or ask questions below each post. Here are some questions that I received
I don't understand, since the first page shown 61, amnestic events seems to predominantly show a 7.5 Hz rhythm in the temporal derivations, but you mention a "well-developed alpha". Similarly, you subsequently state "the page above again demonstrates the temporal alpha frequencies"; there certainly is clear alpha present here but I would have thought that the predominant rhythm is again 7 Hz theta??
One should regard the frequency of temporal alpha in the same way as occipital alpha rhythms. These slow during drowsiness.
Sorry, but I do not see the K complex (as in at best I can see there's not really a clear sleep spindle associated with the vertex wave, although there certainly is quite a bit of beta in the second half of the page??)
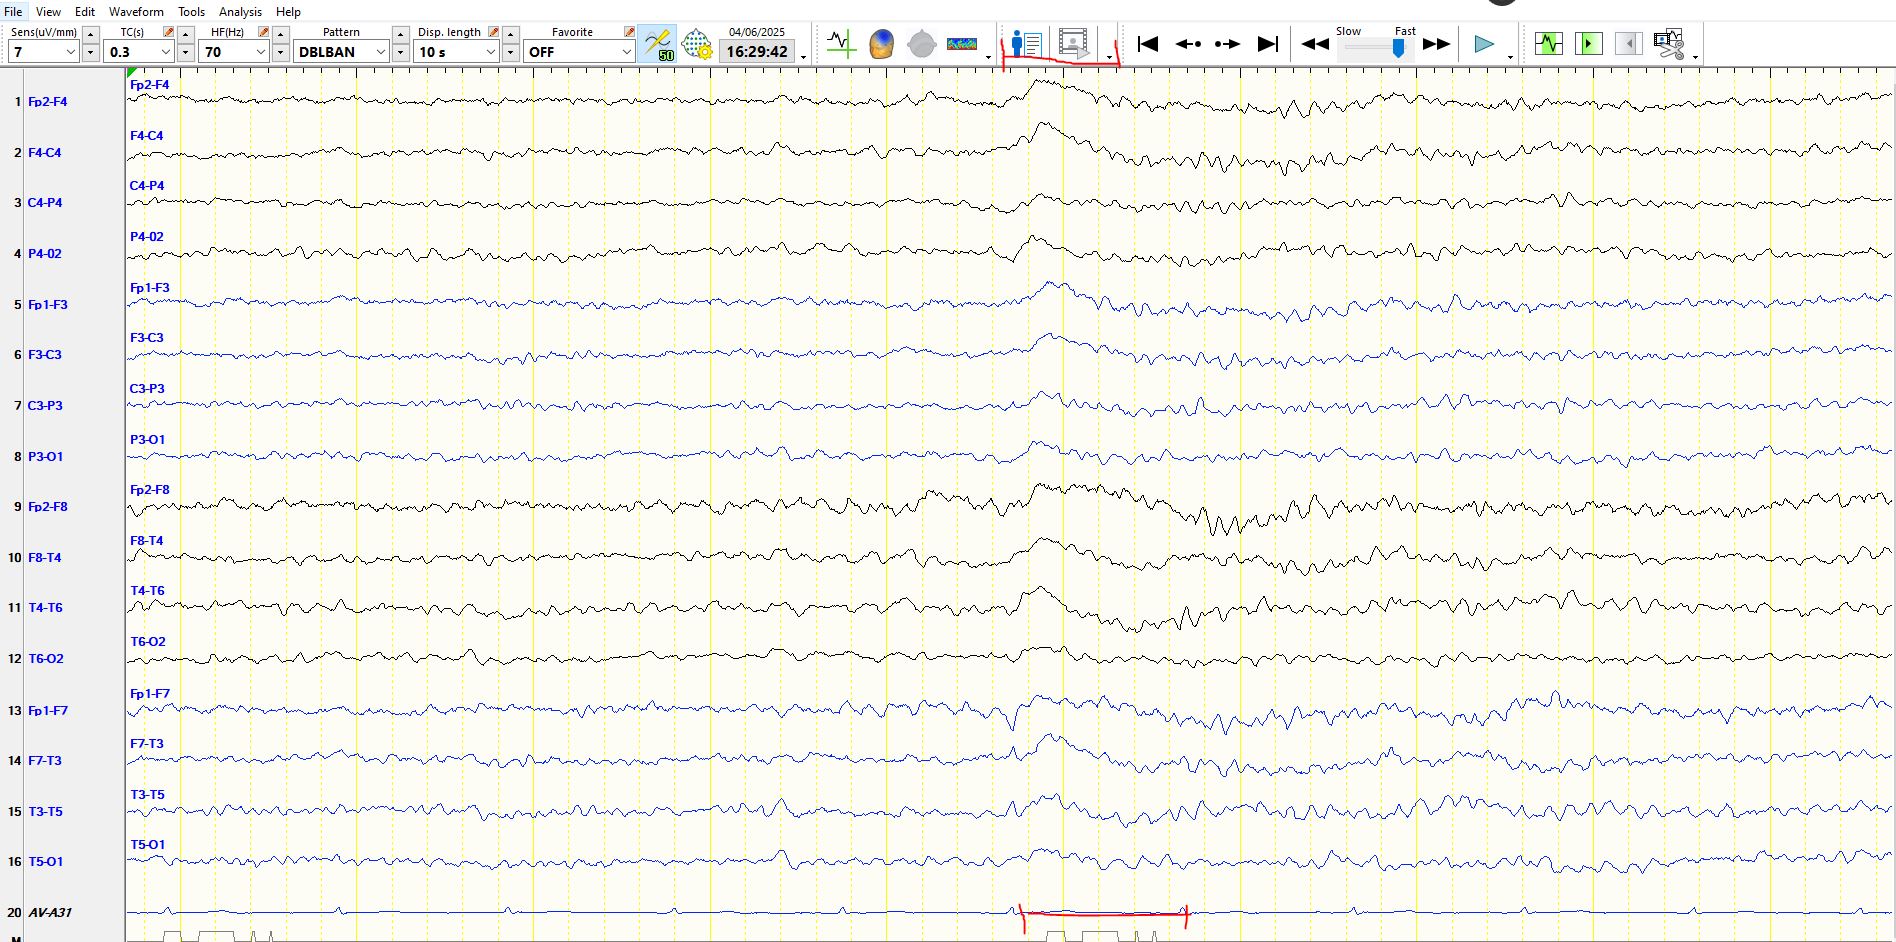
In the image above, patient is asleep and there is a slow wave with a large field at 5-6 seconds on the page above. The duration of this wave is greater than 0.5 seconds. K-complexes have a variable location, often frontally-predominant, as in this case. The image below represents same page, but on bipolar montage. The K-complexes corresponds to the red line at the top and bottom
No rush to answer- but was reading the article you posted with the wicked waves- I’m unclear- as they really do look like spikes over several regions. What would be the best way to definitively call these wicked vs epileptic? Is it a change in the montage?
Yes, they do resemble spikes and that is the point of the post. These waves, even when they occur as single waveforms, should be unambiguously different from background rhythms that appear in the same derivations. In this instance they do not. Here are a few more examples
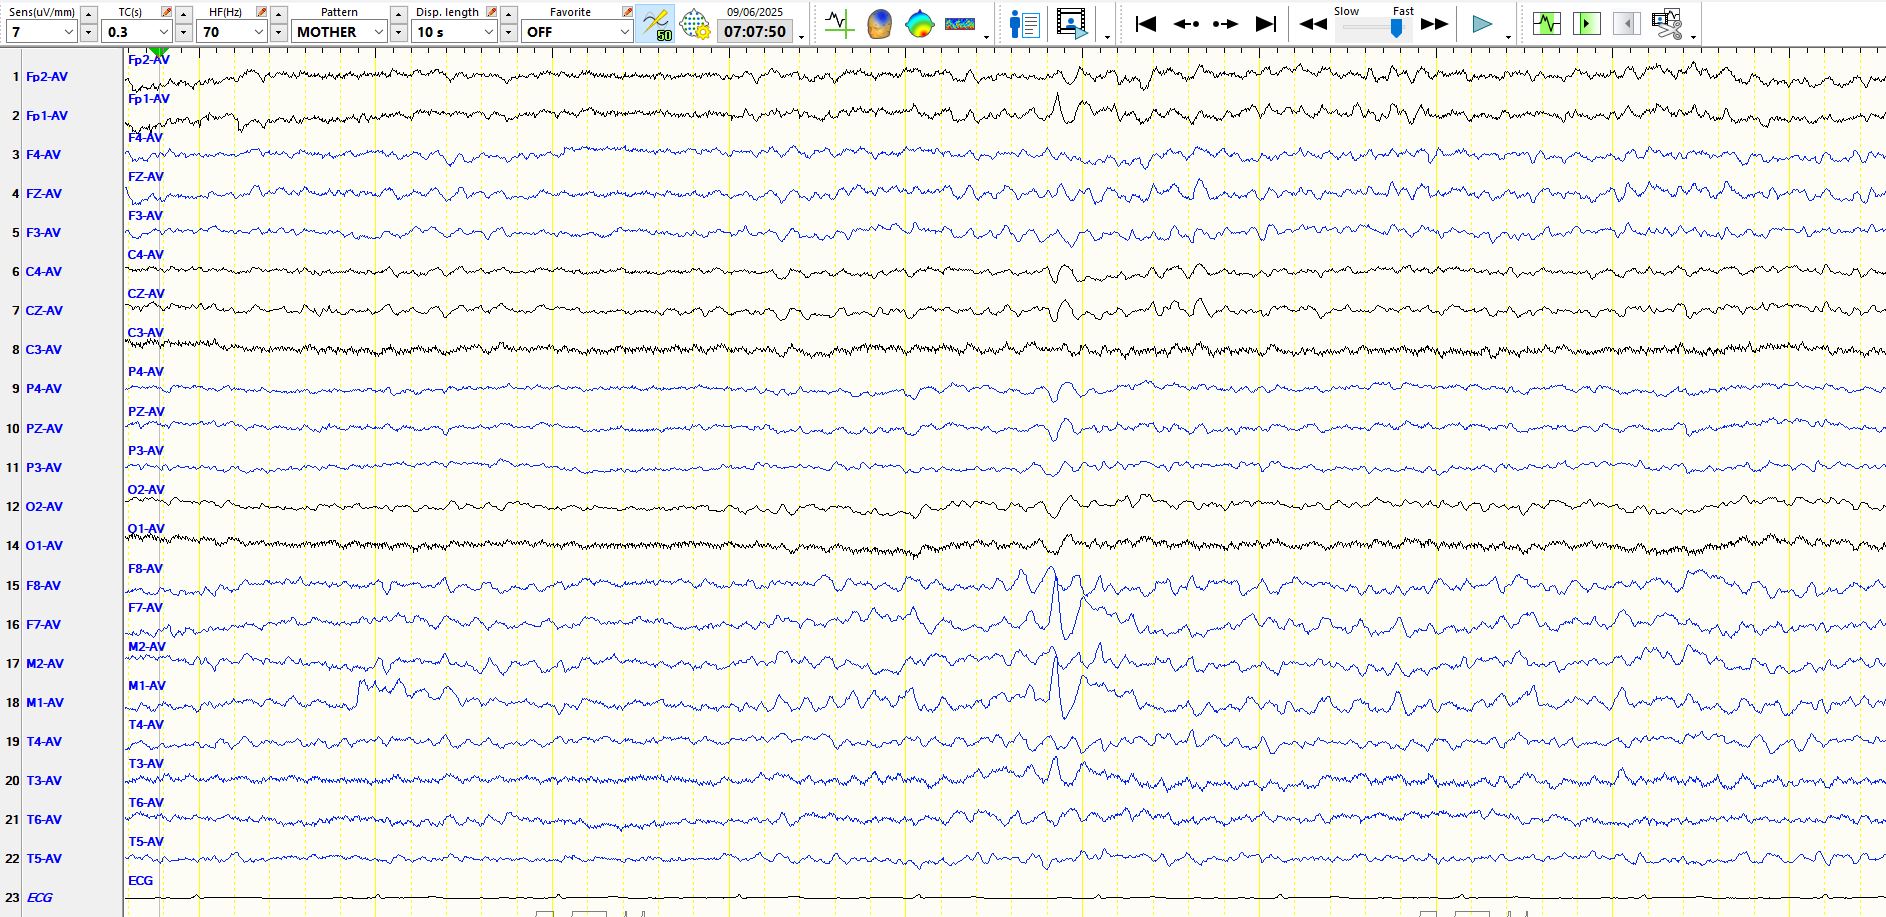
The following 3 pages represent the same wave in different montages. In the referential montage below, notice that the wave that is of maximal amplitude in F7 is preceded by waveforms of a similar morphology and frequency, and these are progressively increasing in amplitude. This is key. You can see the same phenomenon in T3 and just for good measure there are waves over the right temporal region, lower and amplitude, but of a similar frequency and morphology.

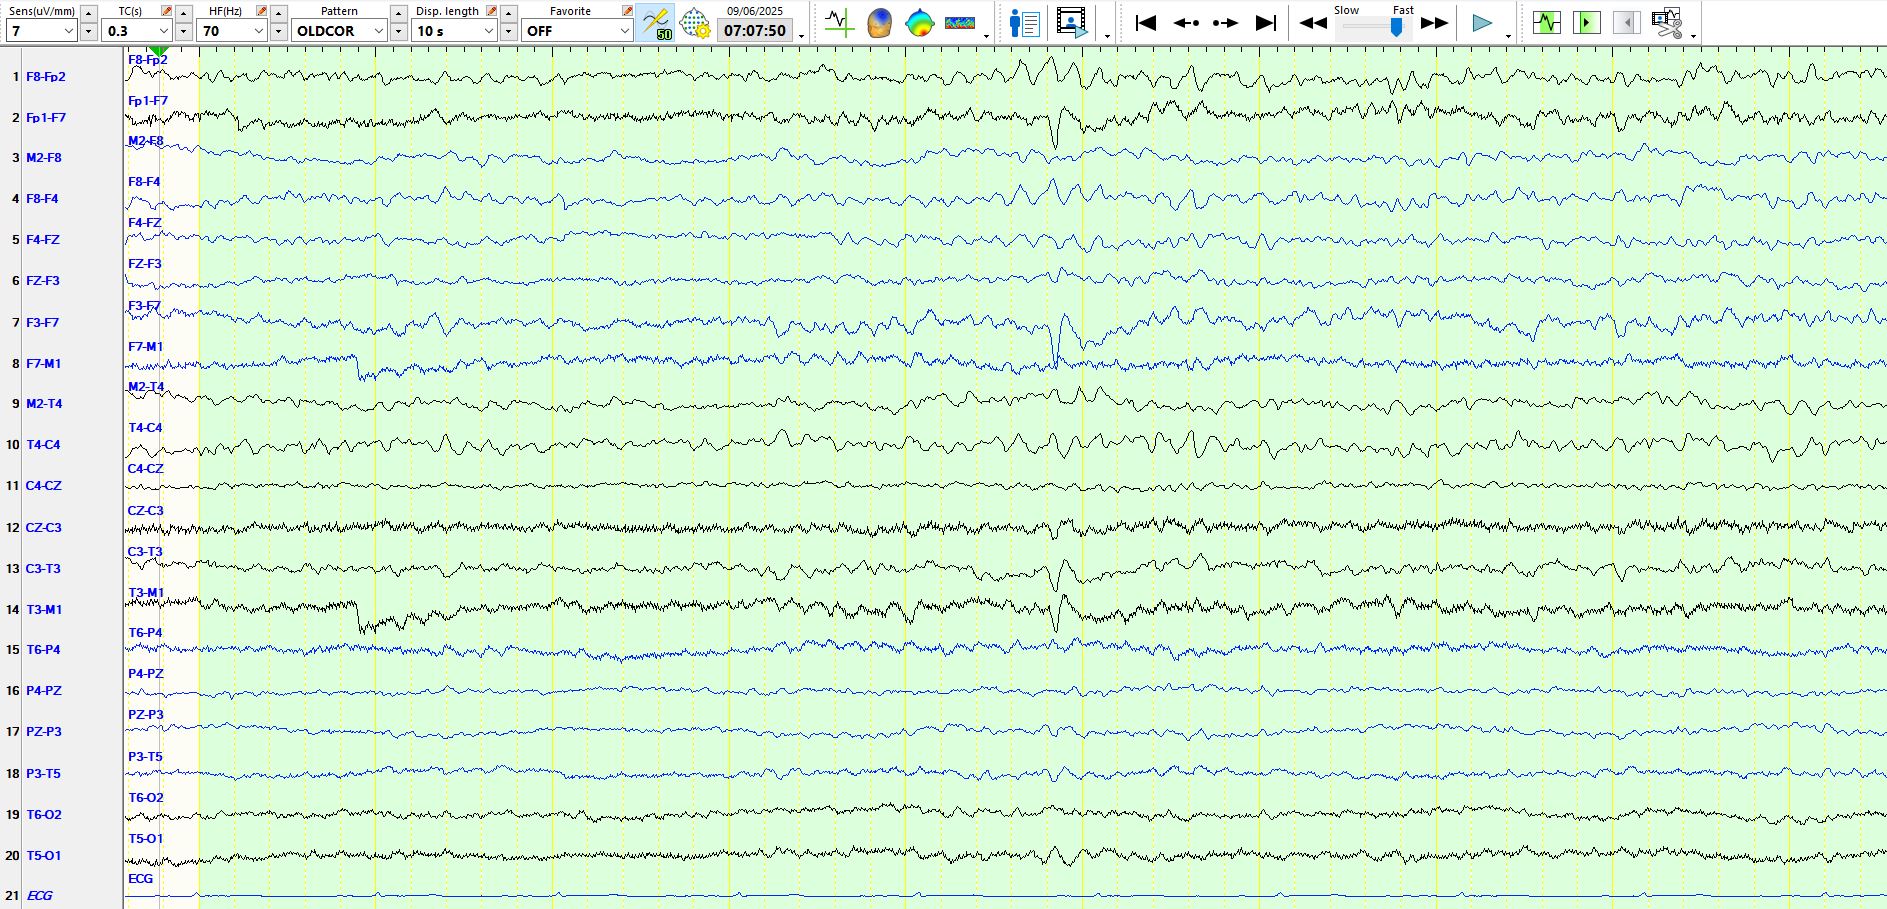
Exactly the same principles enunciated above appliy to the page below
Never read a single page of an EEG in isolation; the page below demonstrates some of the background rhythms necessary to interpret apiculate waves in the temporal regions
Below is an example of a similar progressive increase in the amplitude of same rhythm
Here is another example of the above phenomenon
And, just for good measure, the patient had rare waveforms of a similar nature on the right, Illustrated below

One really cannot look at these examples enough:

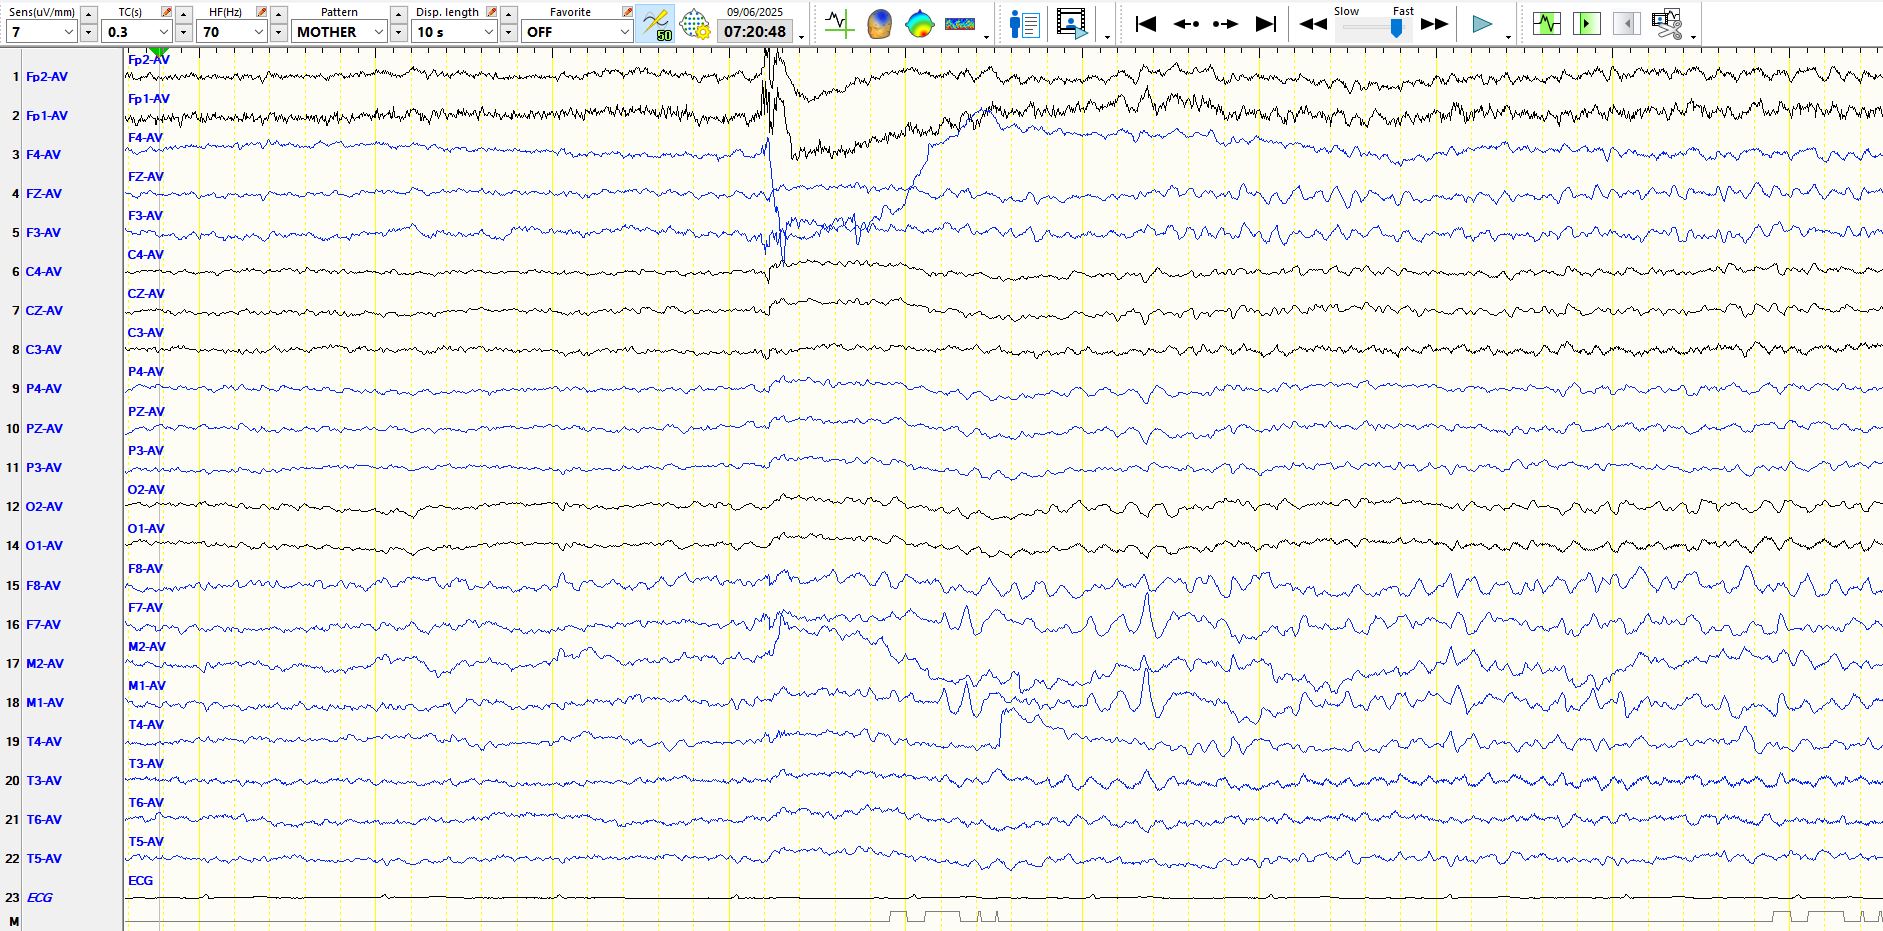
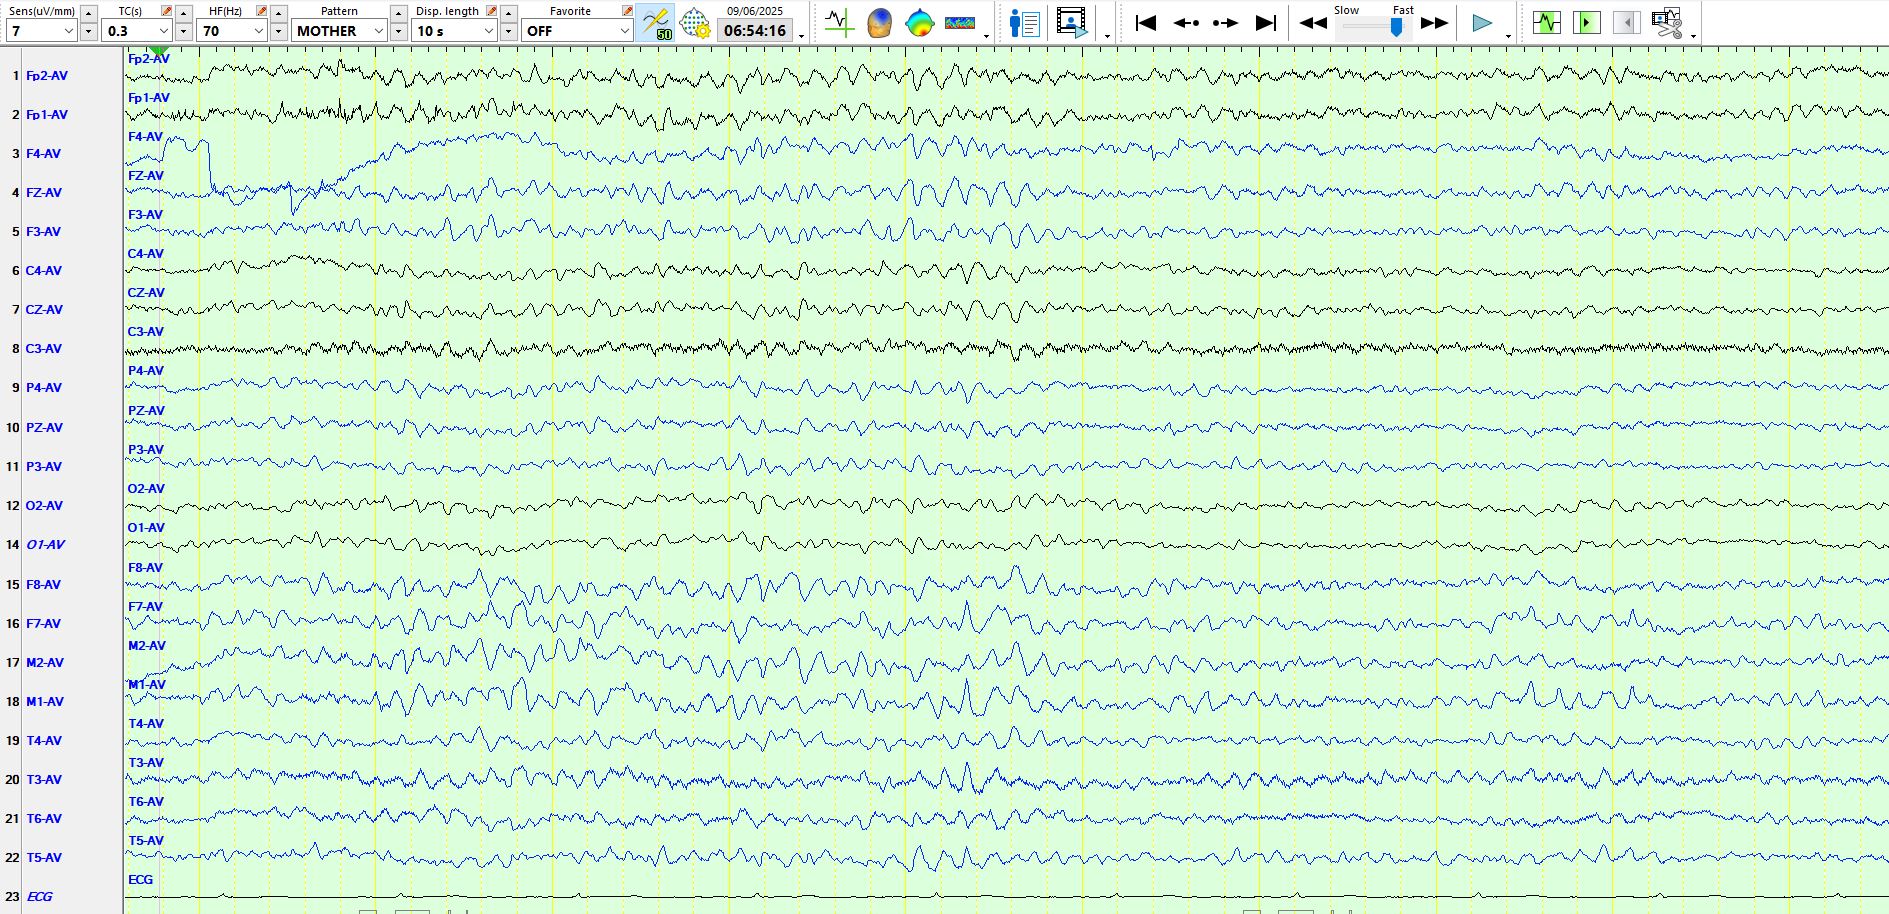
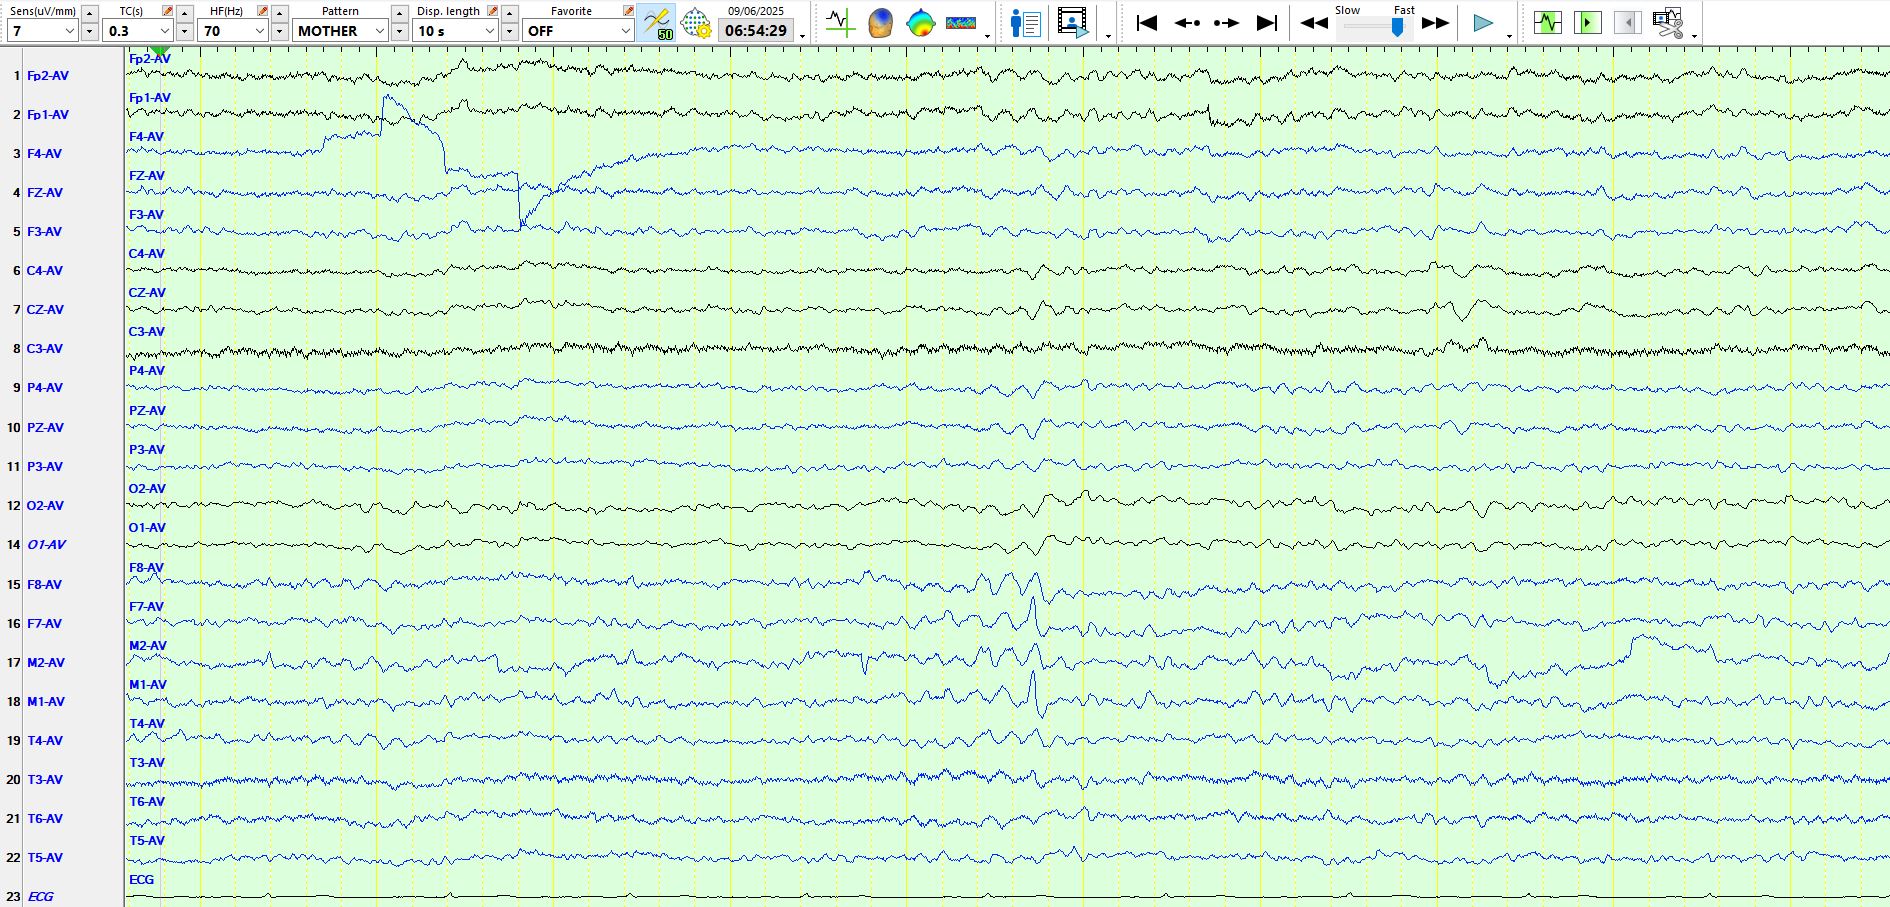
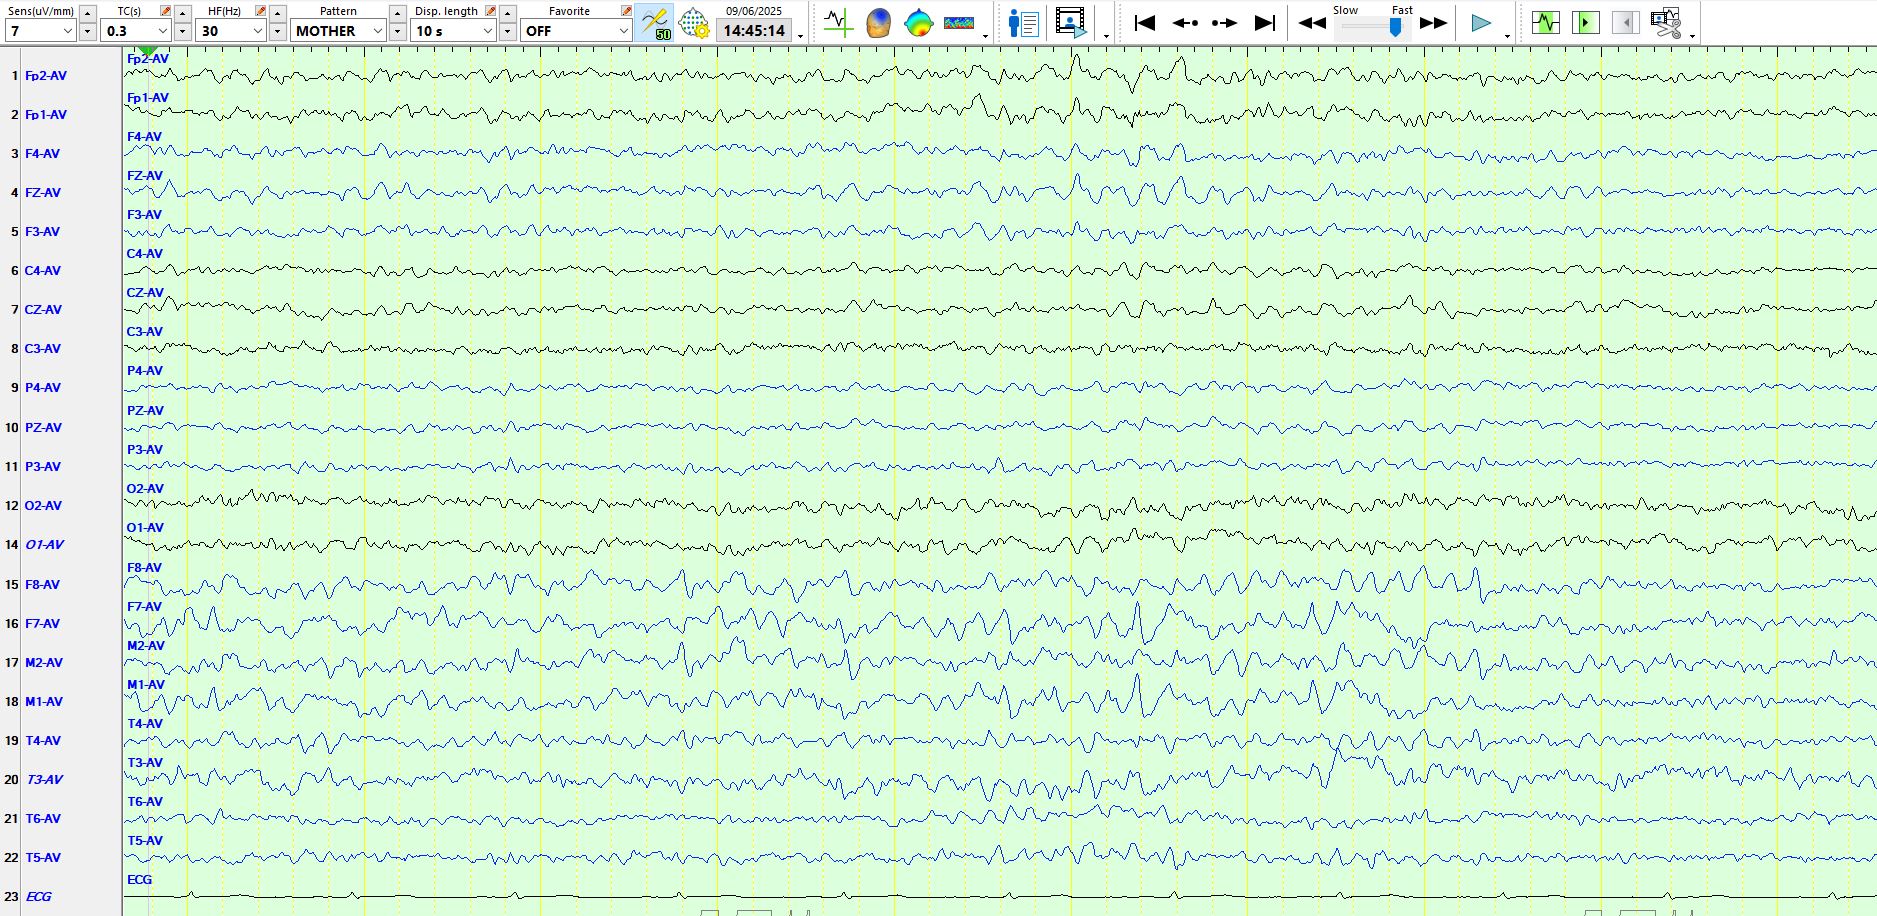
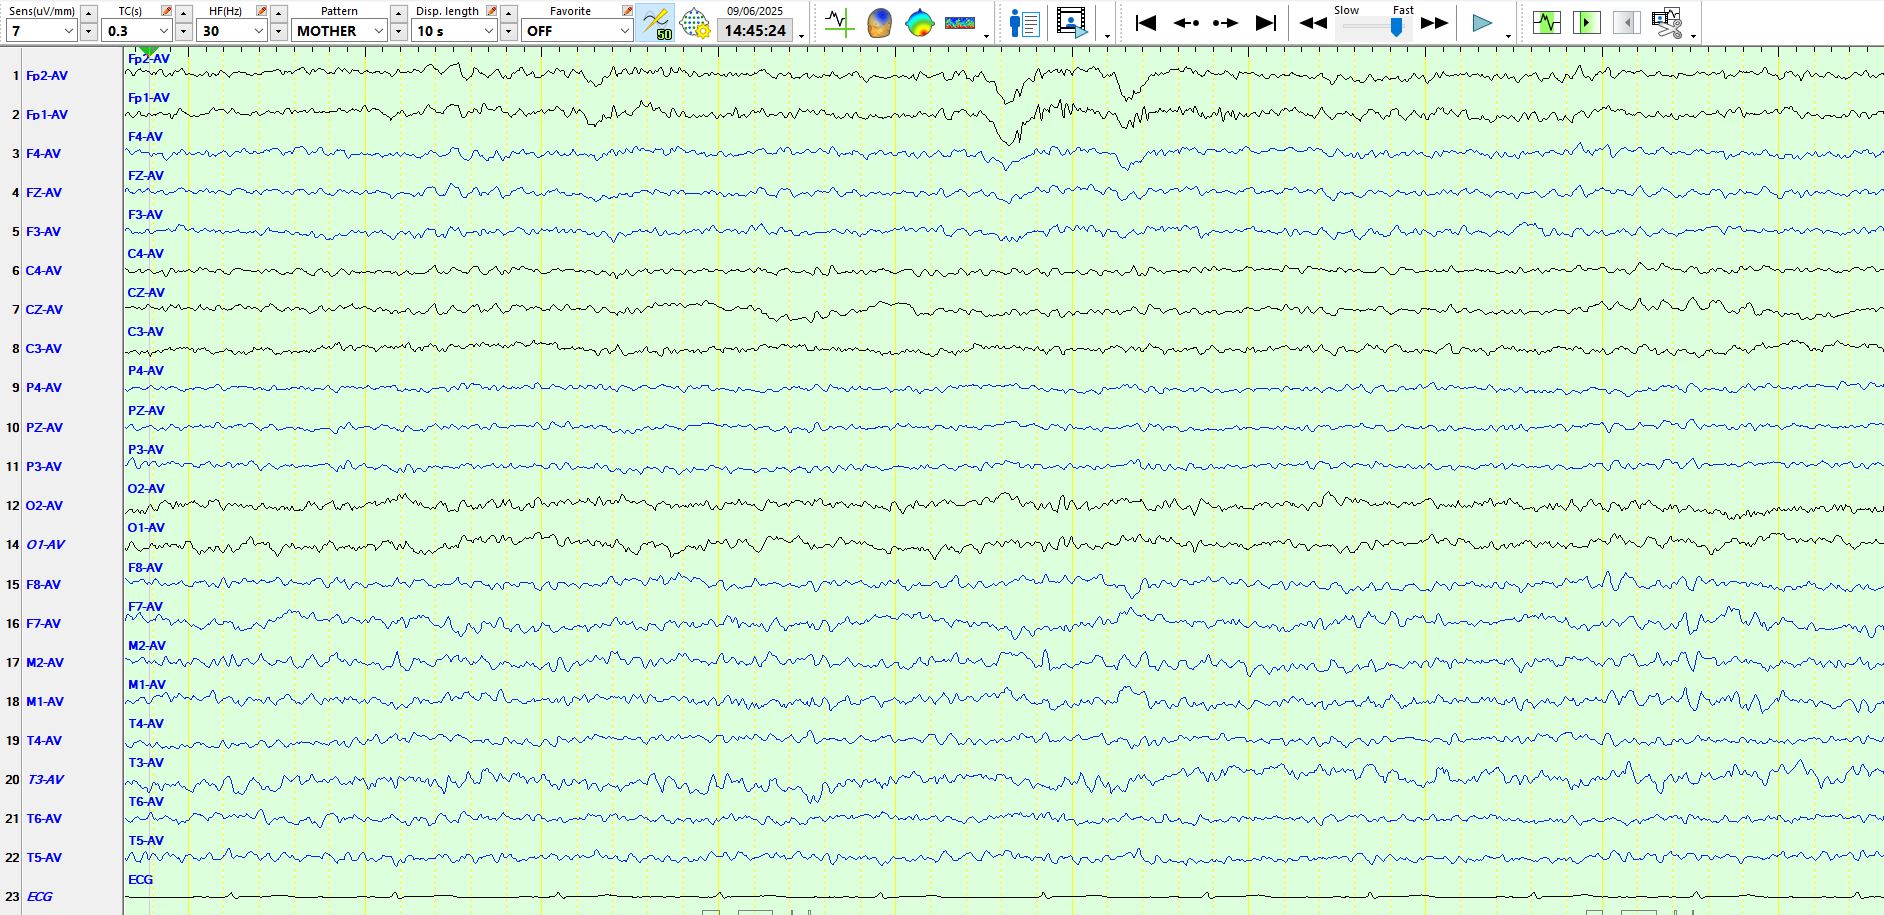
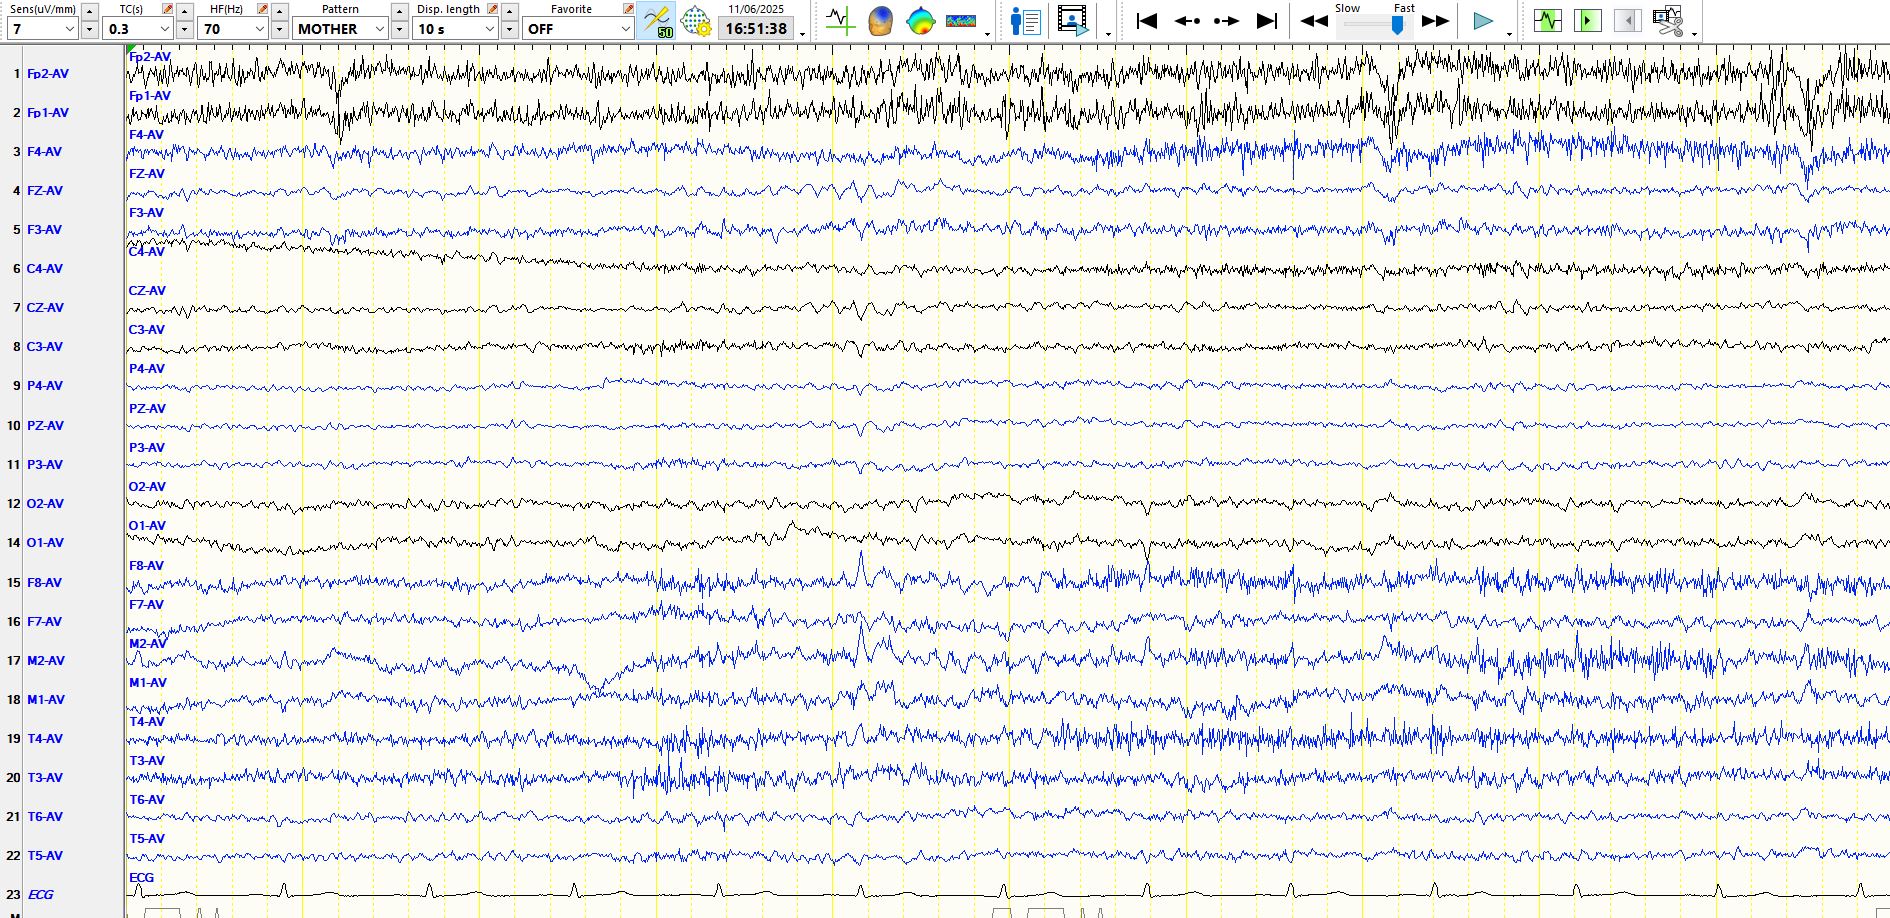
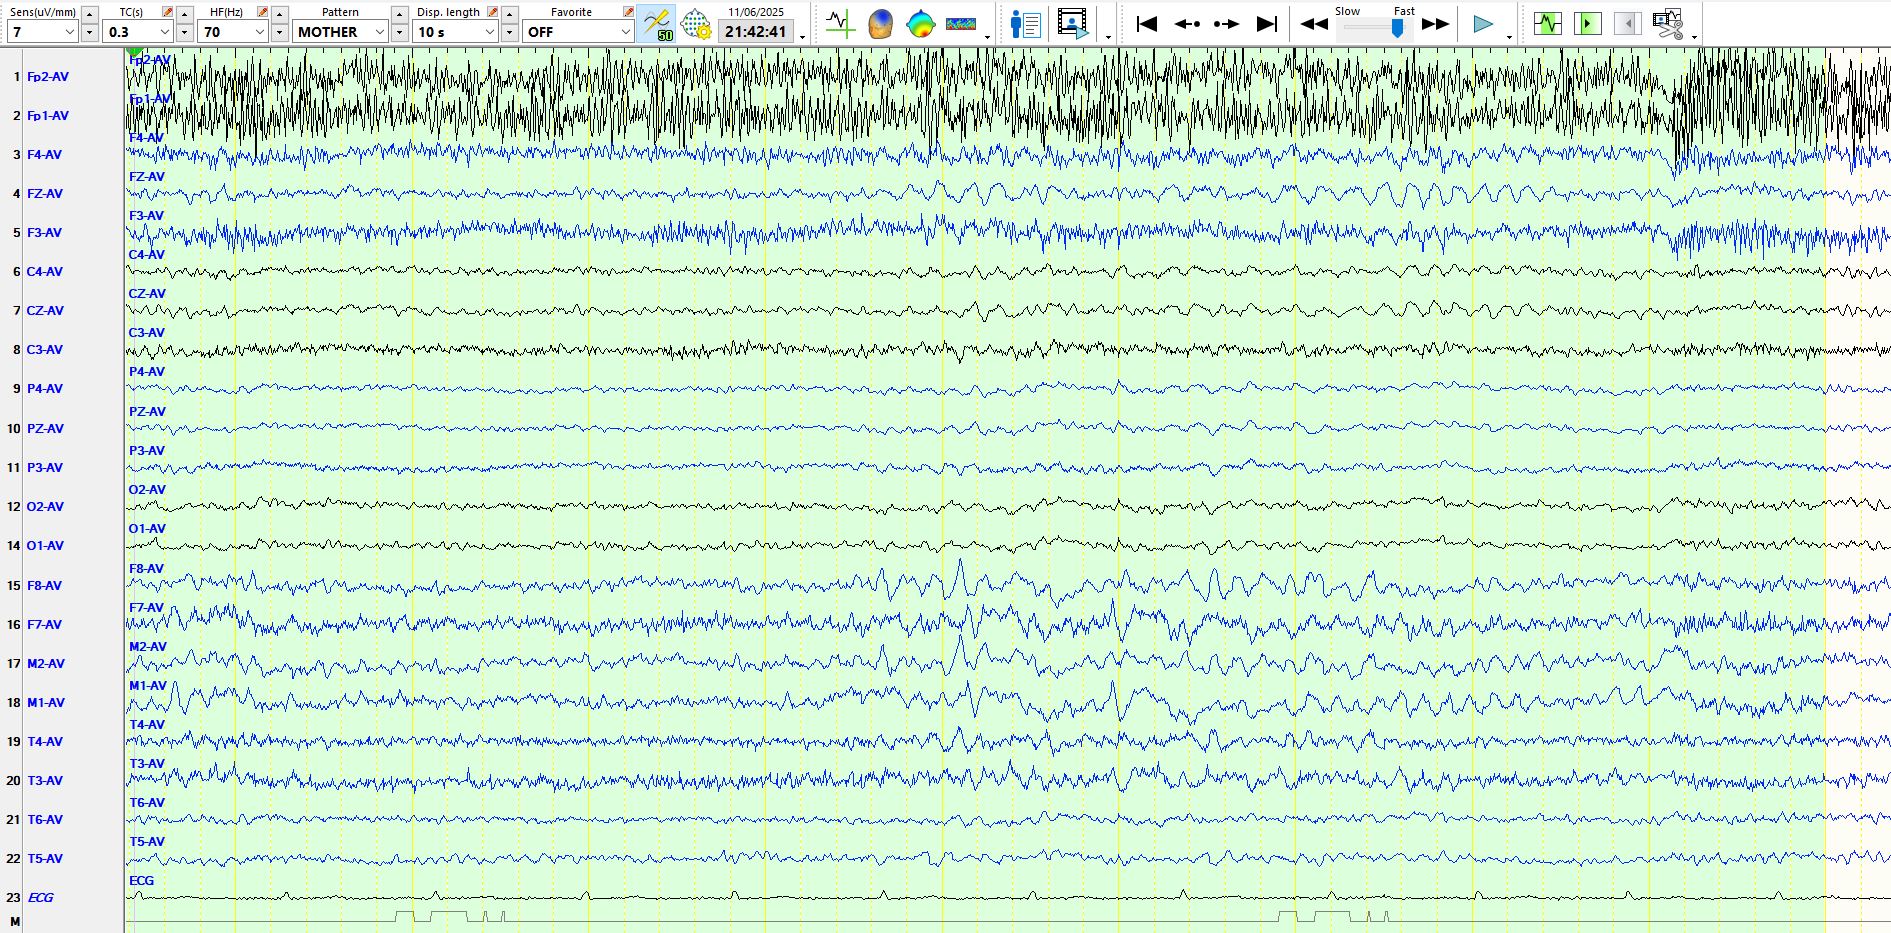
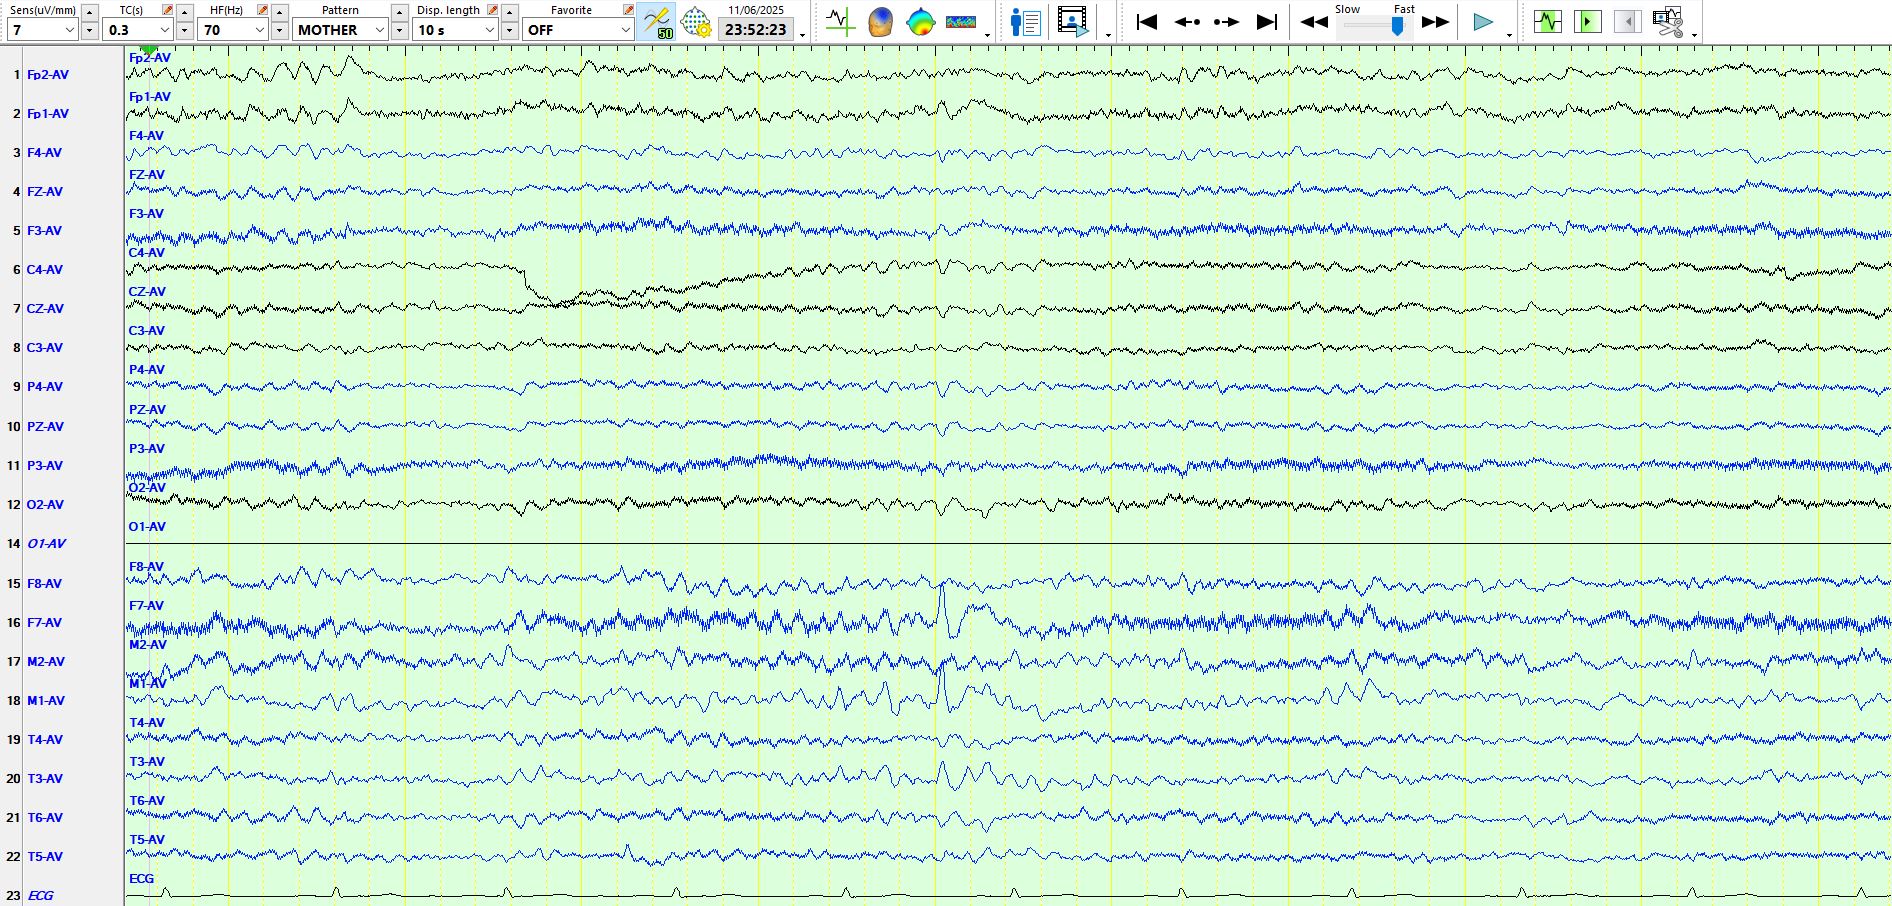
The following are 3 sequential pages to illustrate the waxing and waning nature of these waves over the temporal regions
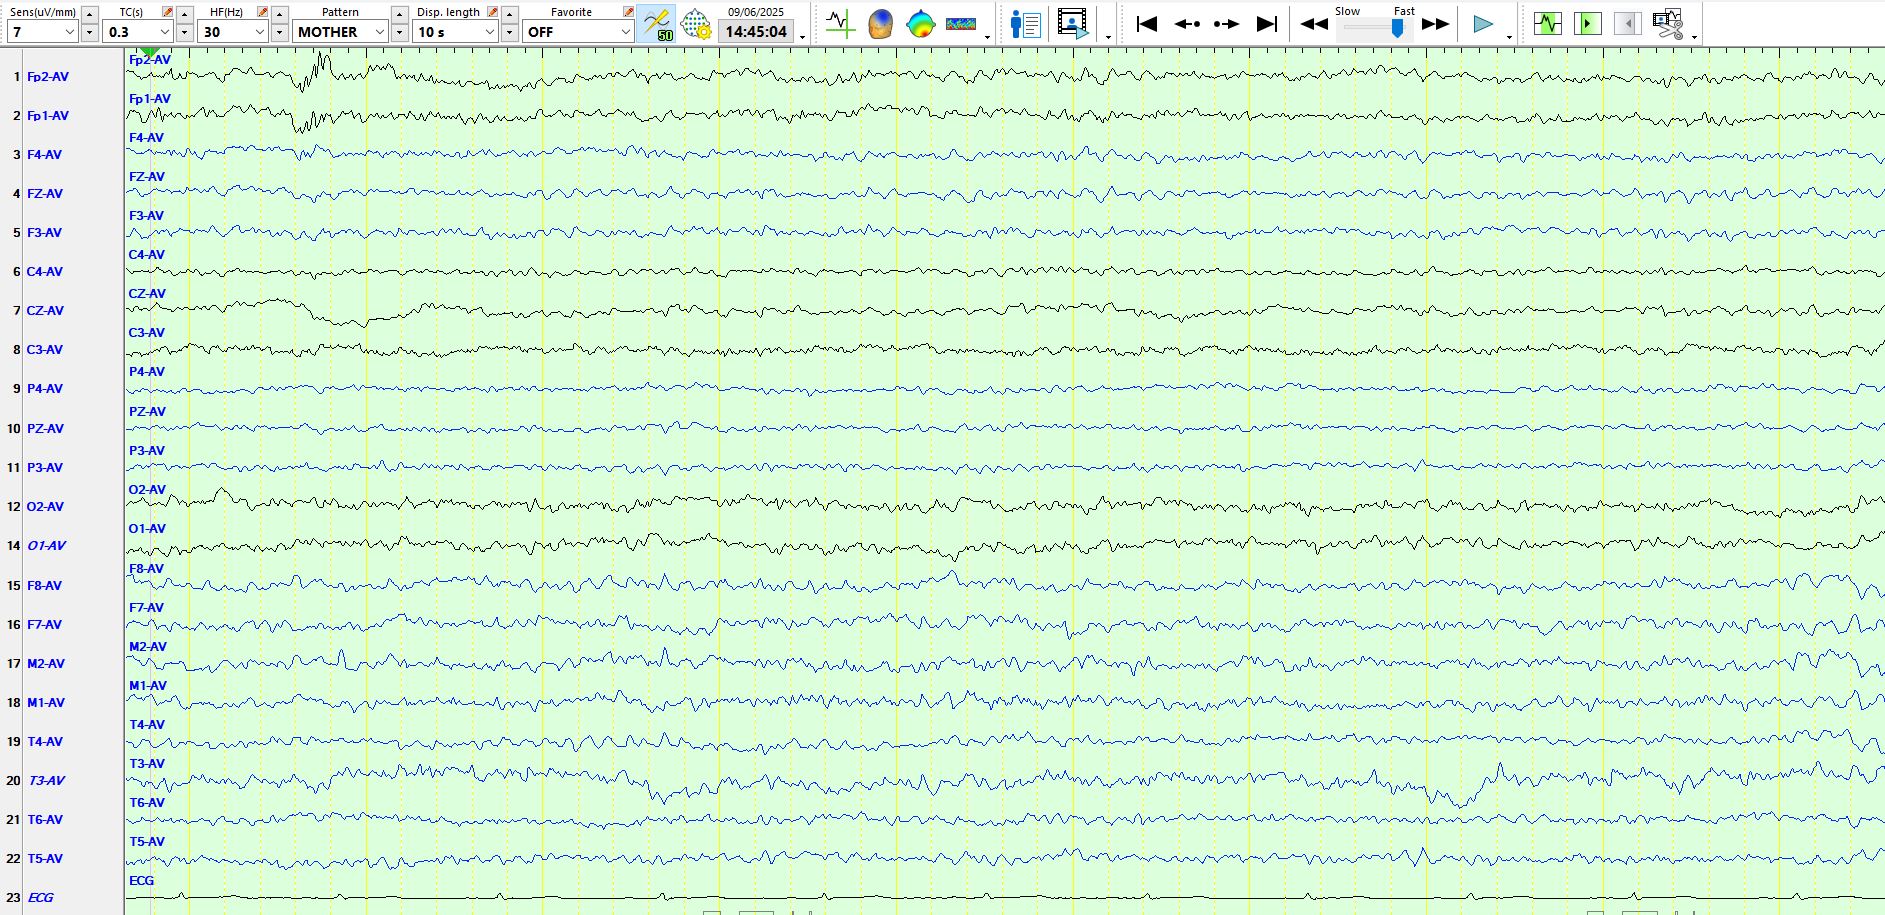
Background in temporal lobes in this patient, drowsy
In the above there is a sequence of wicket waves at F8-M2-T4
Bilateral wicket waves in the above
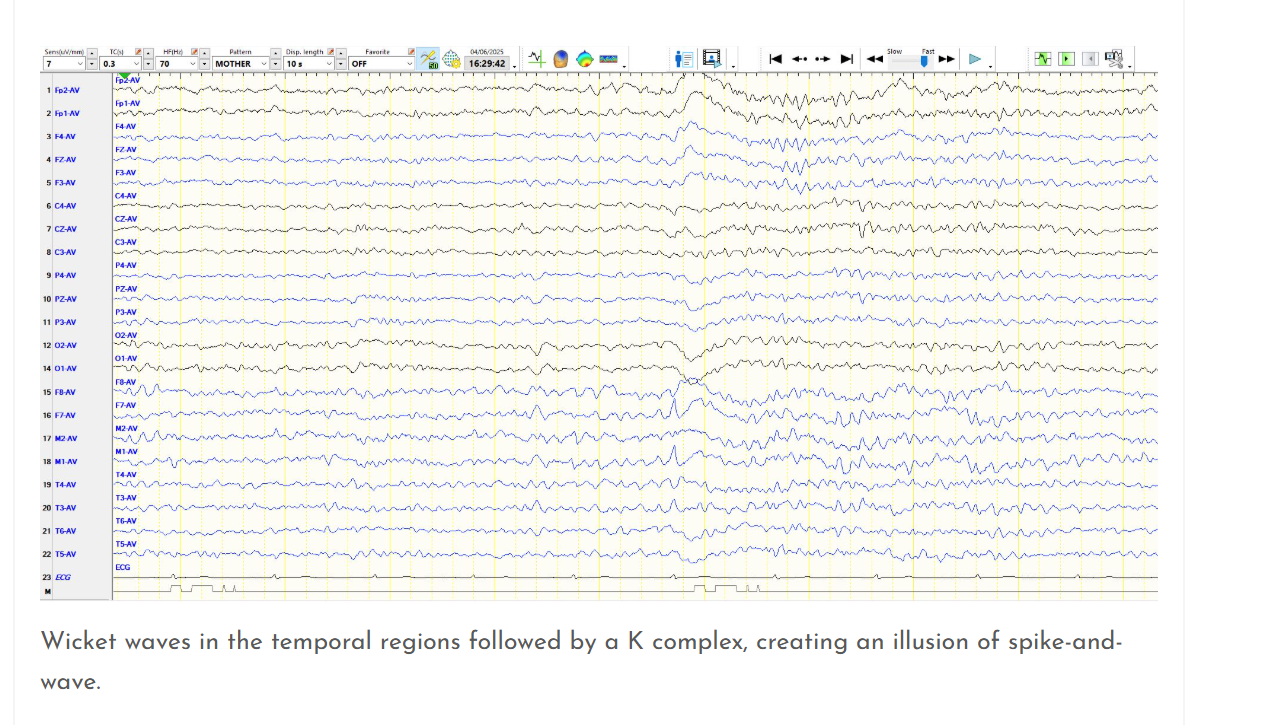
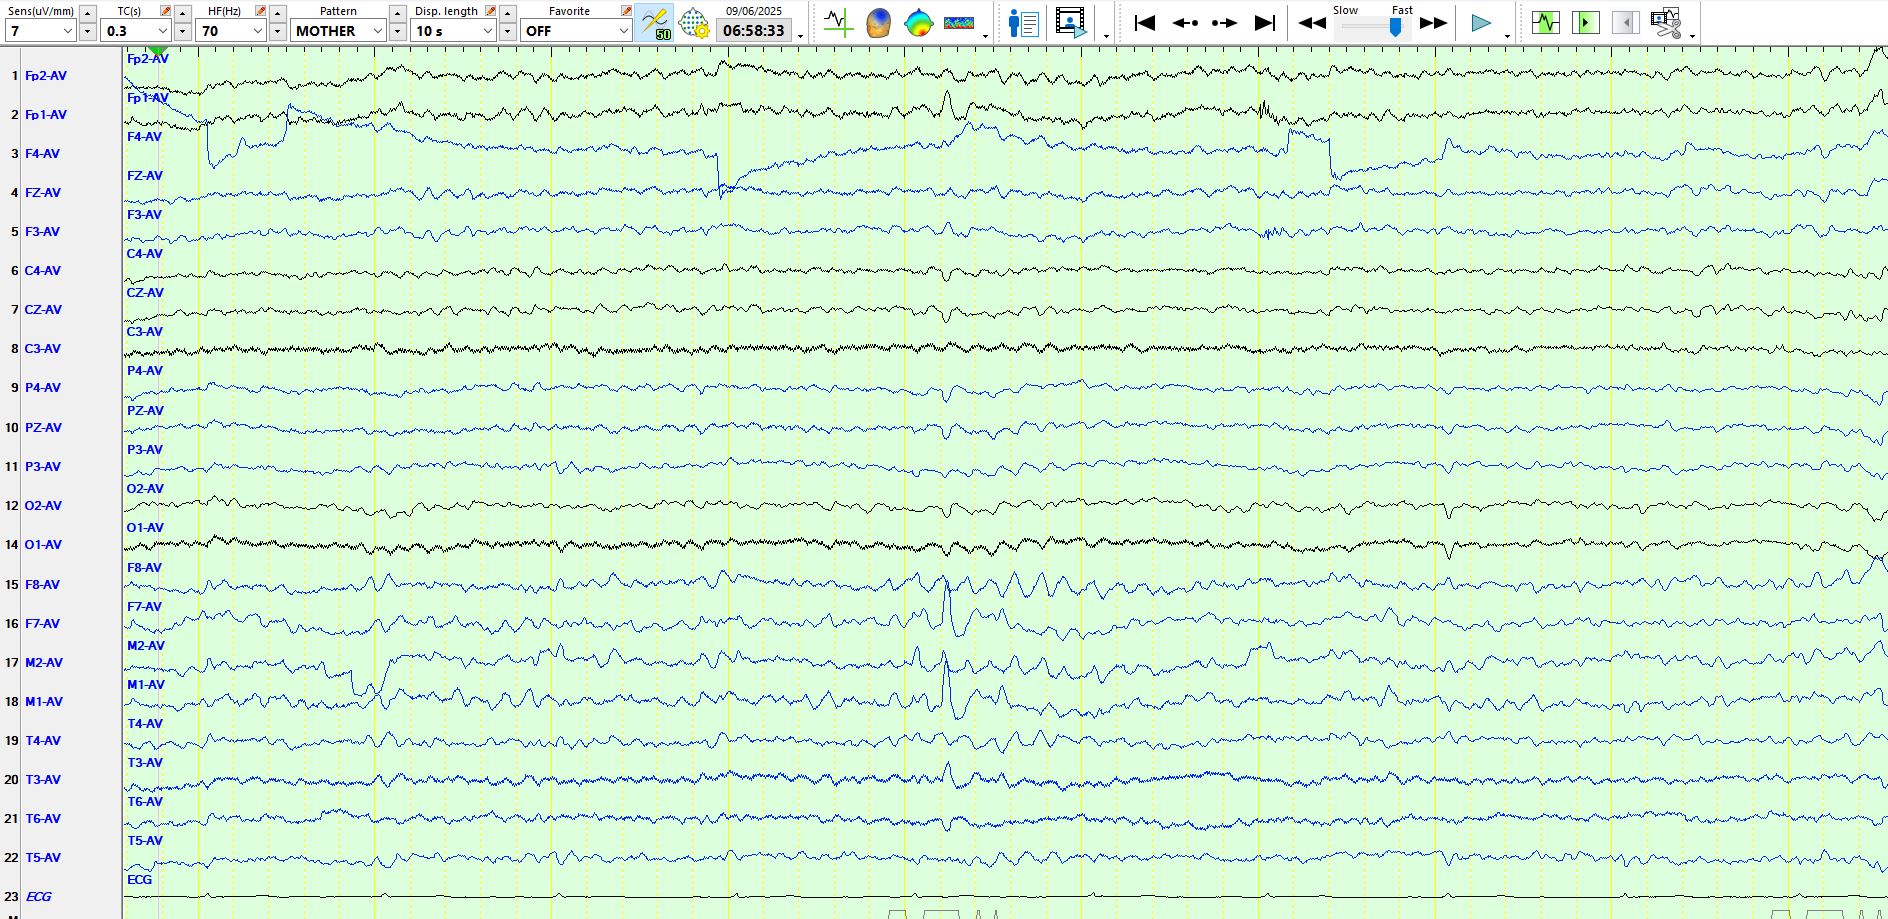
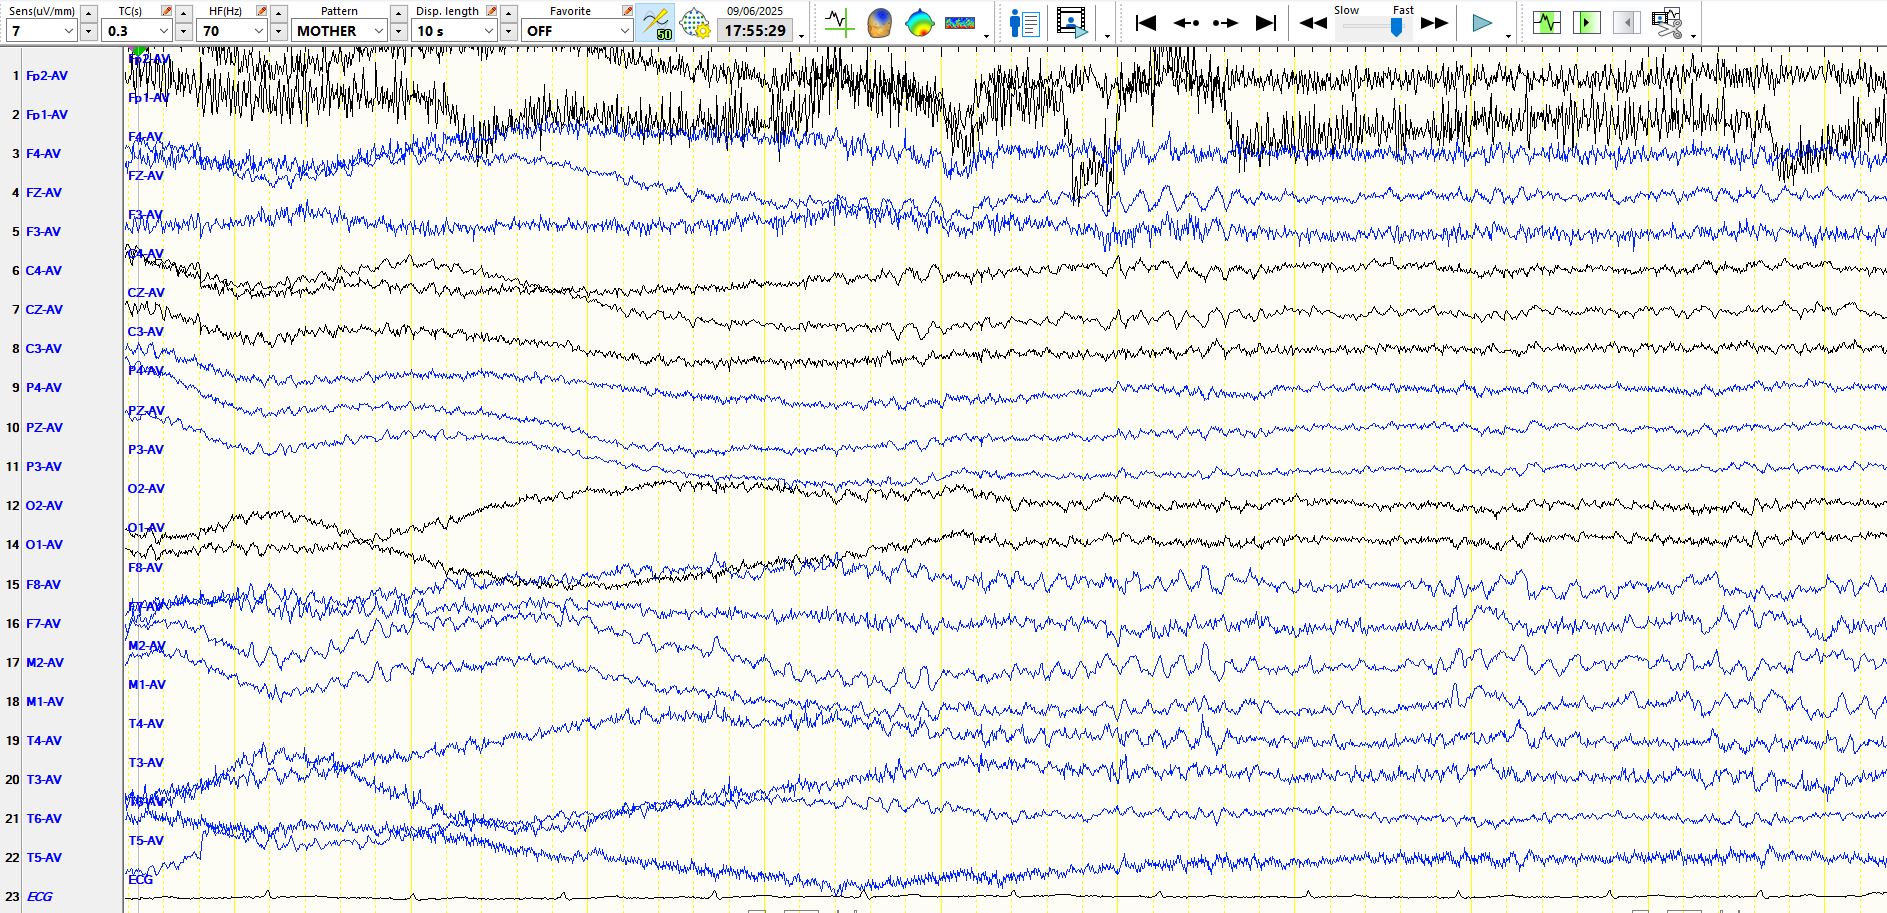
Above is another example of "pseudo-spike and wave" with a "wicked wave" followed by a slow wave
PS: it is still not clear whether this patient has epilepsy or not; work in progress. Watch this space