
61, amnestic events
Jun 06, 2025Epilepsy?
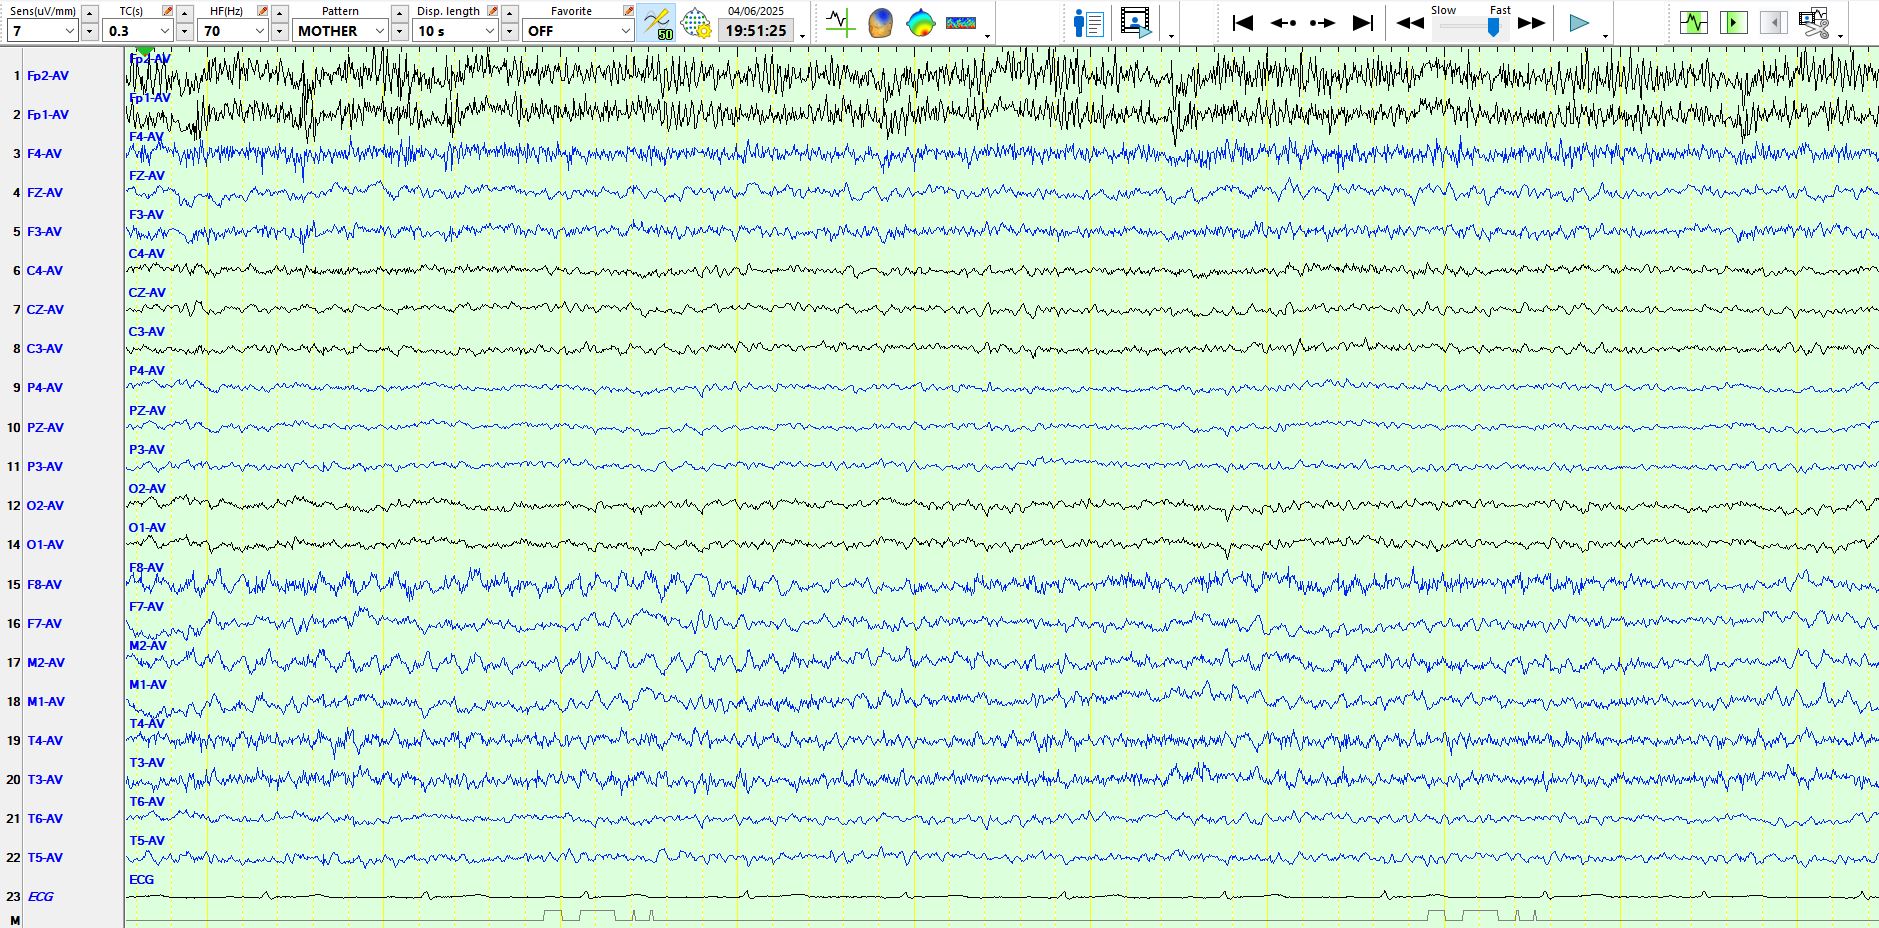
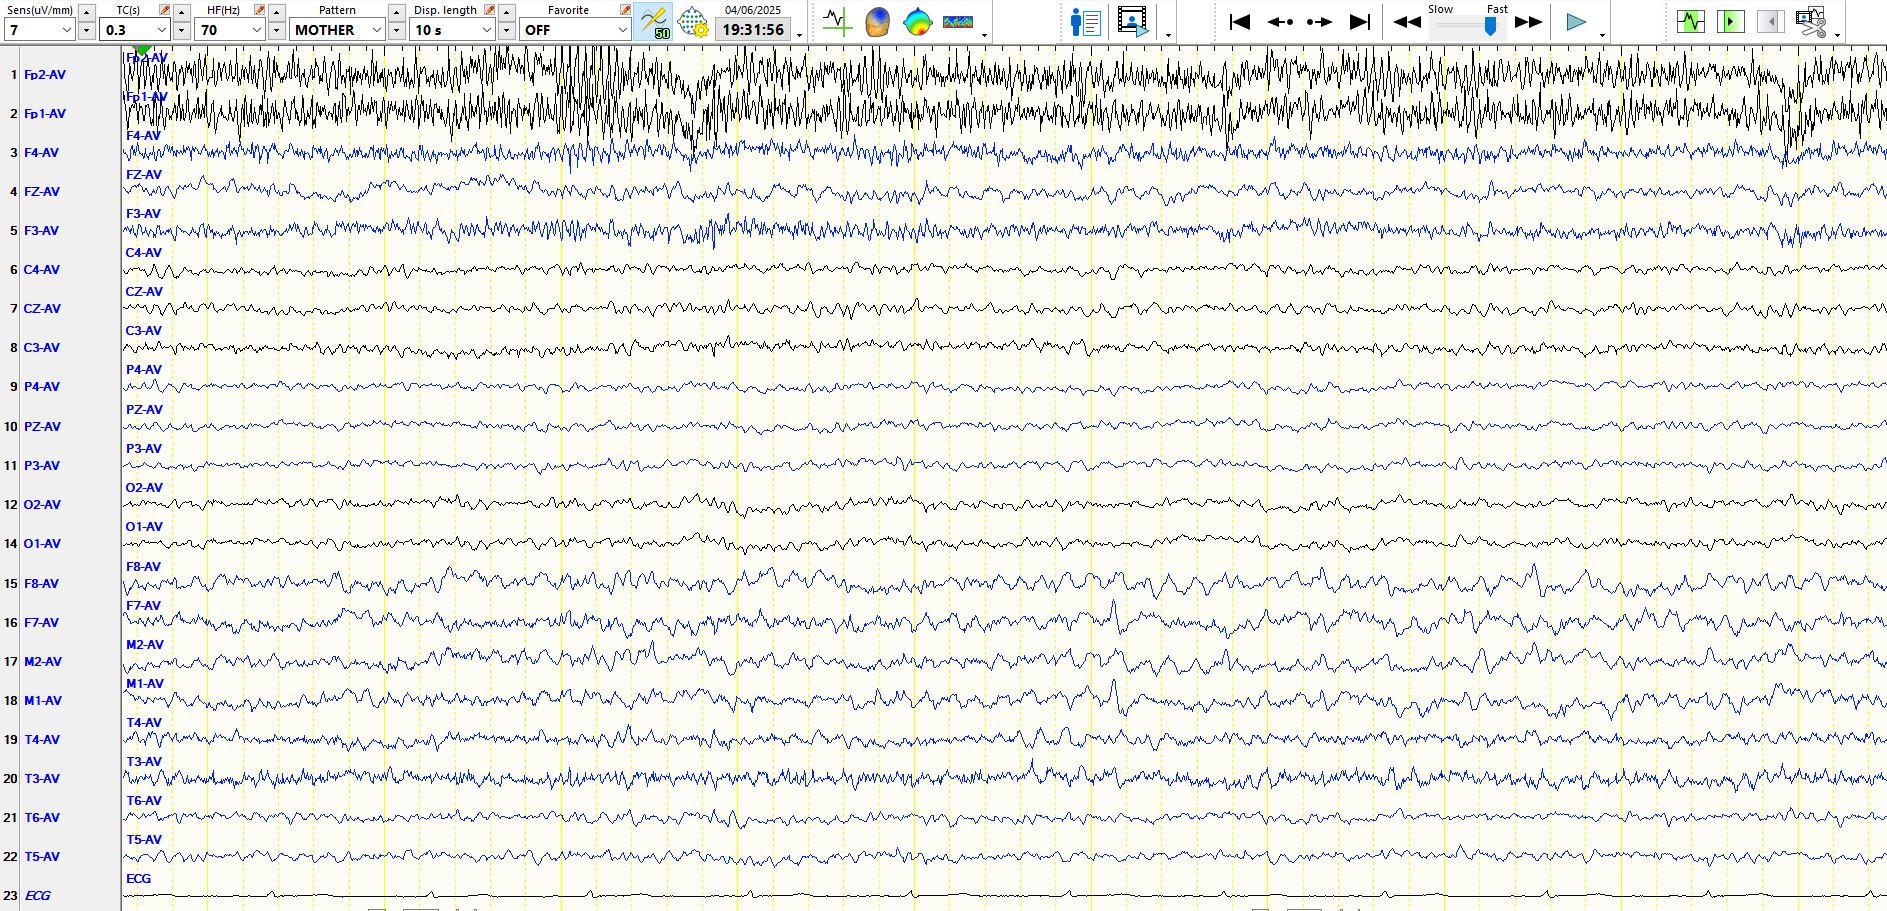
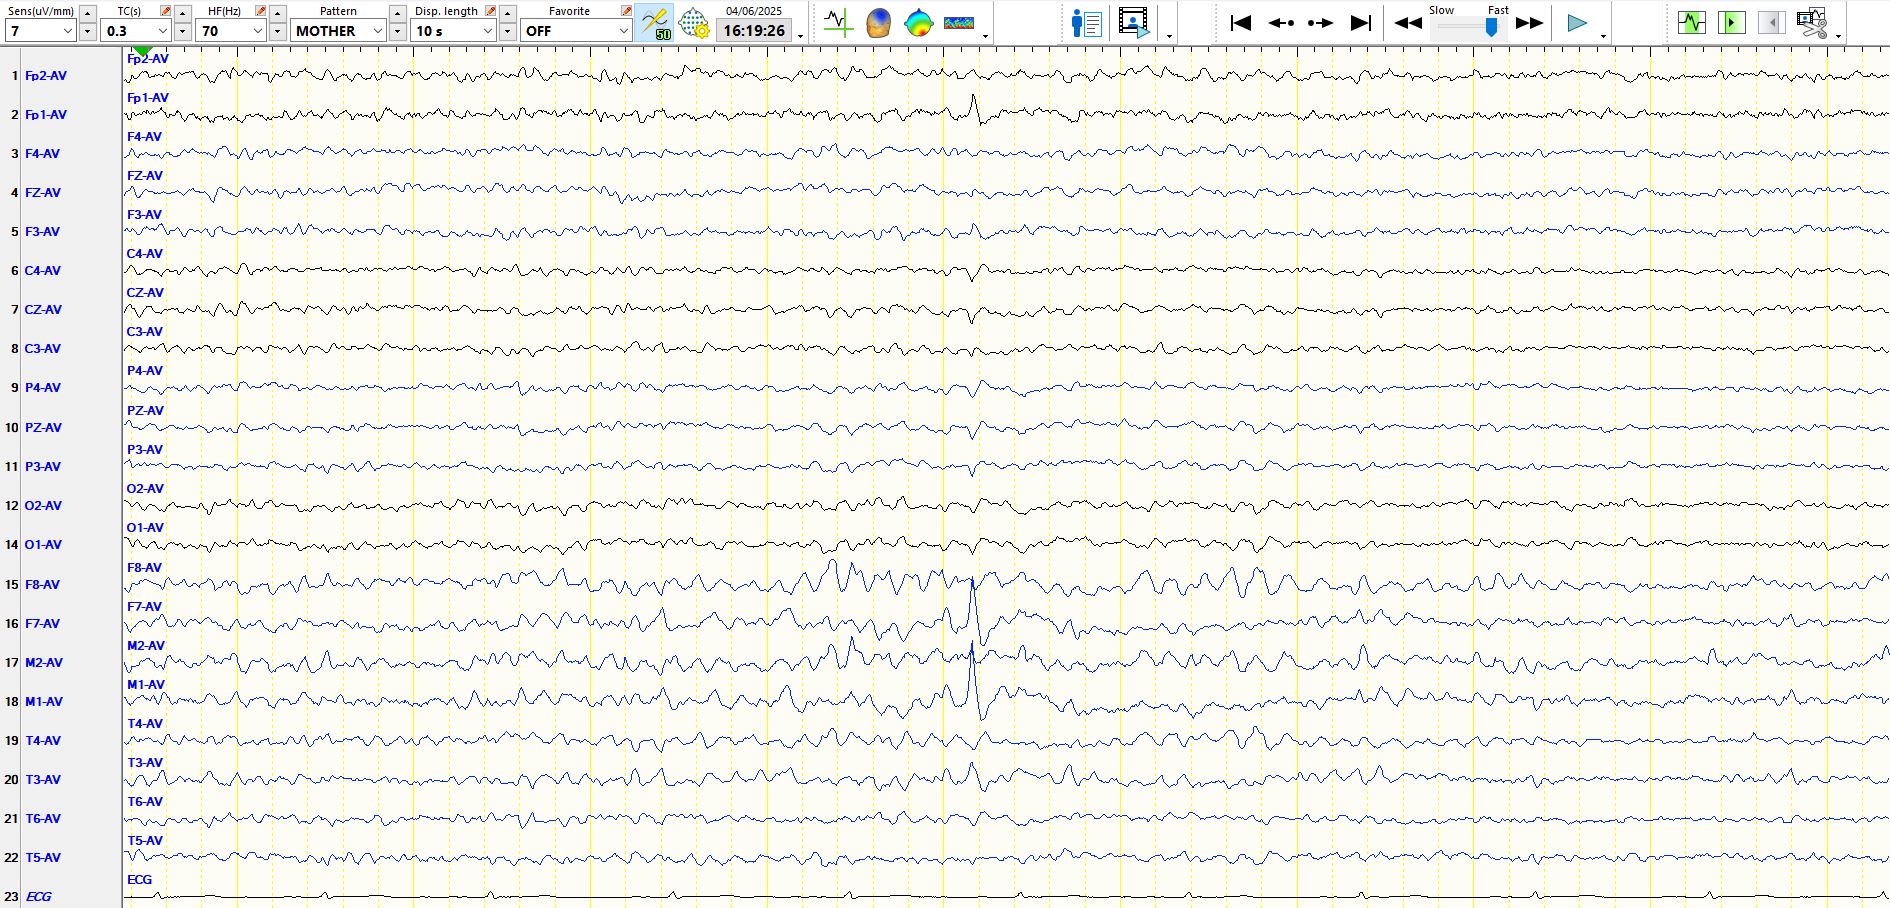
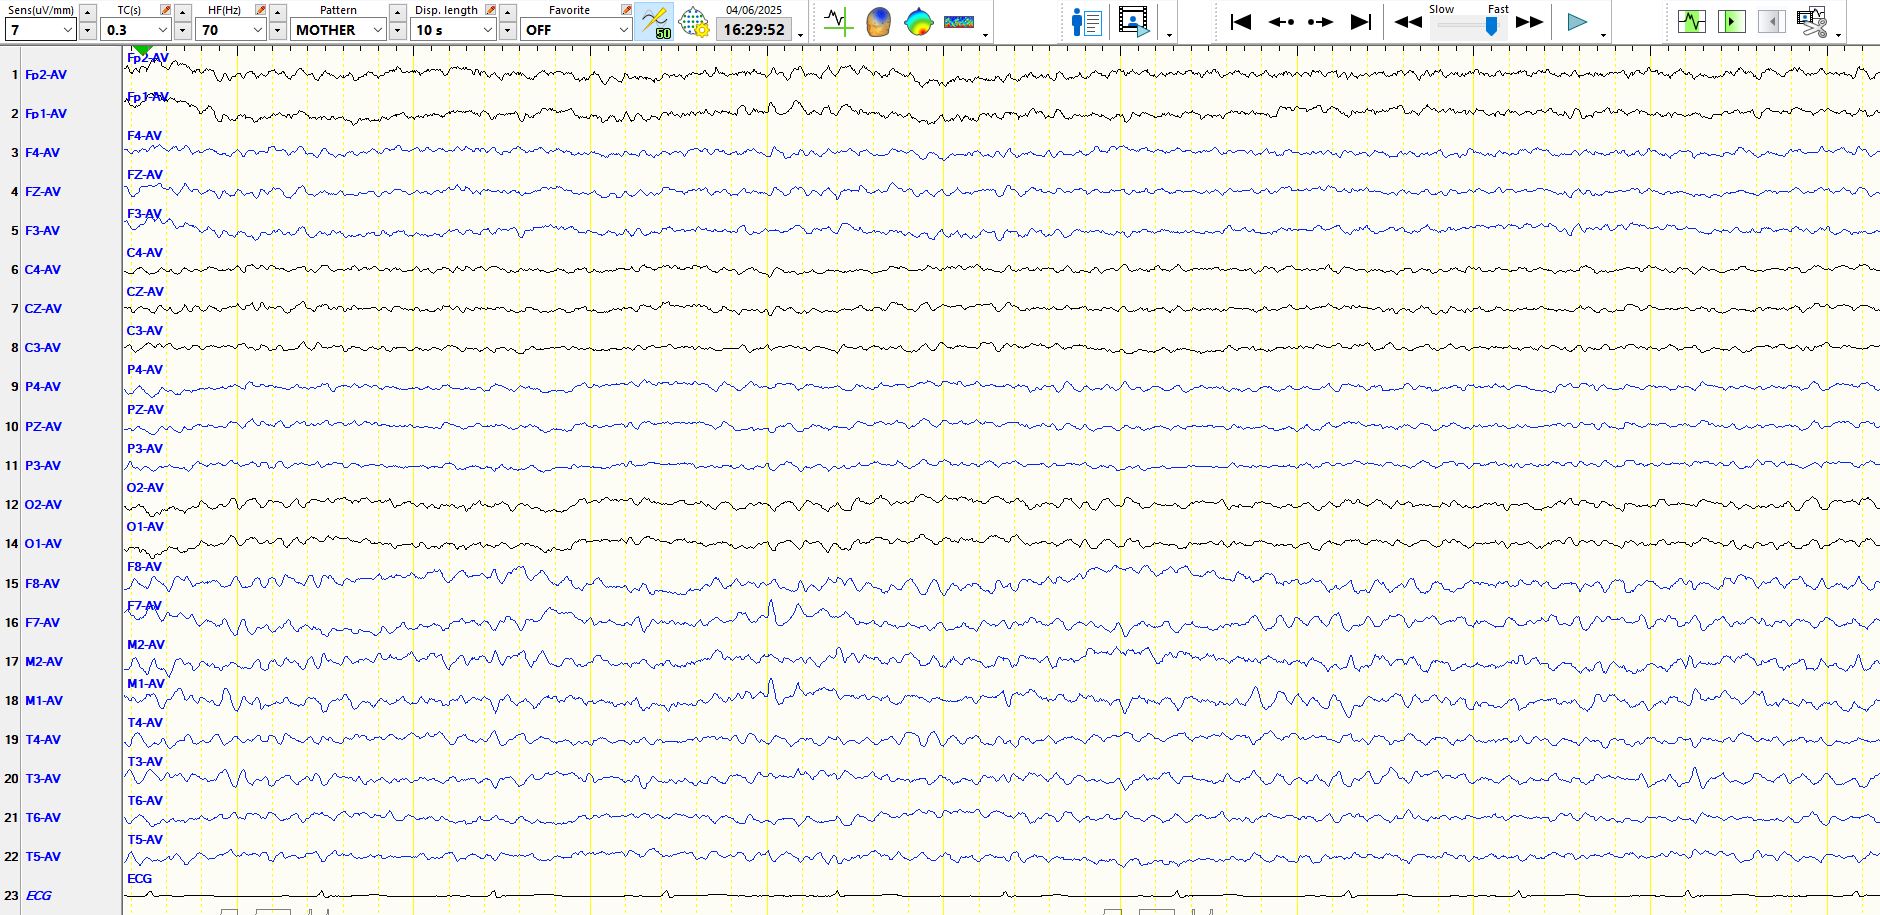
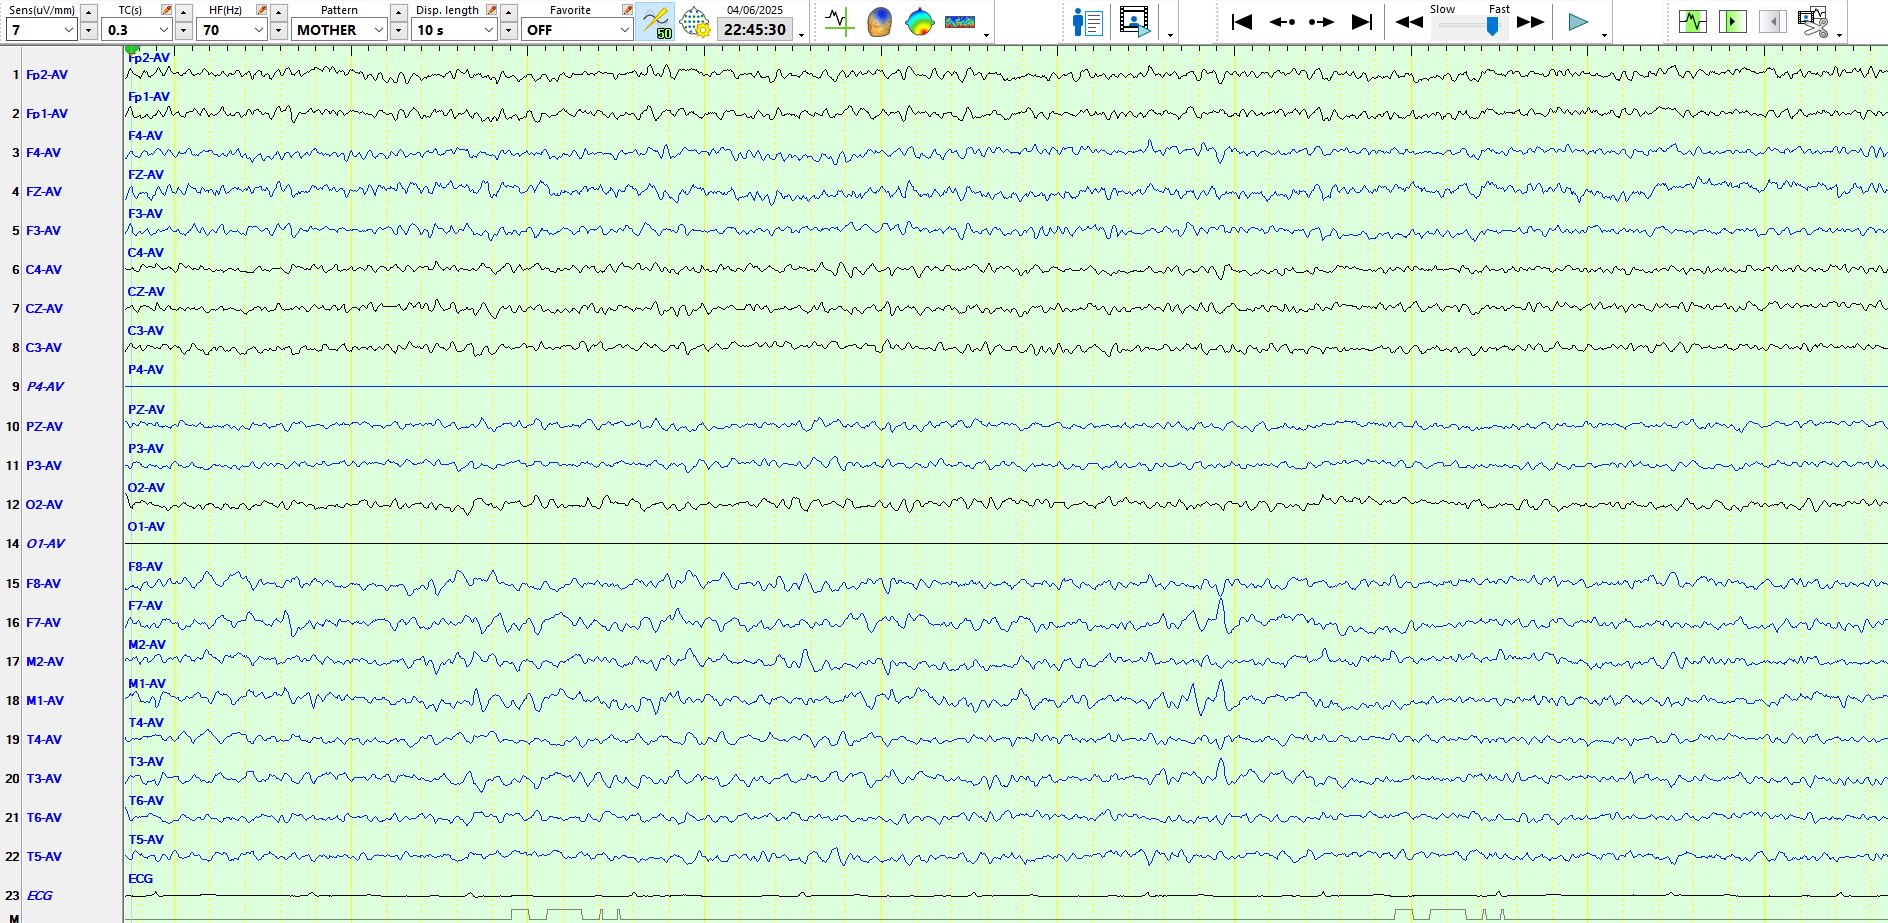
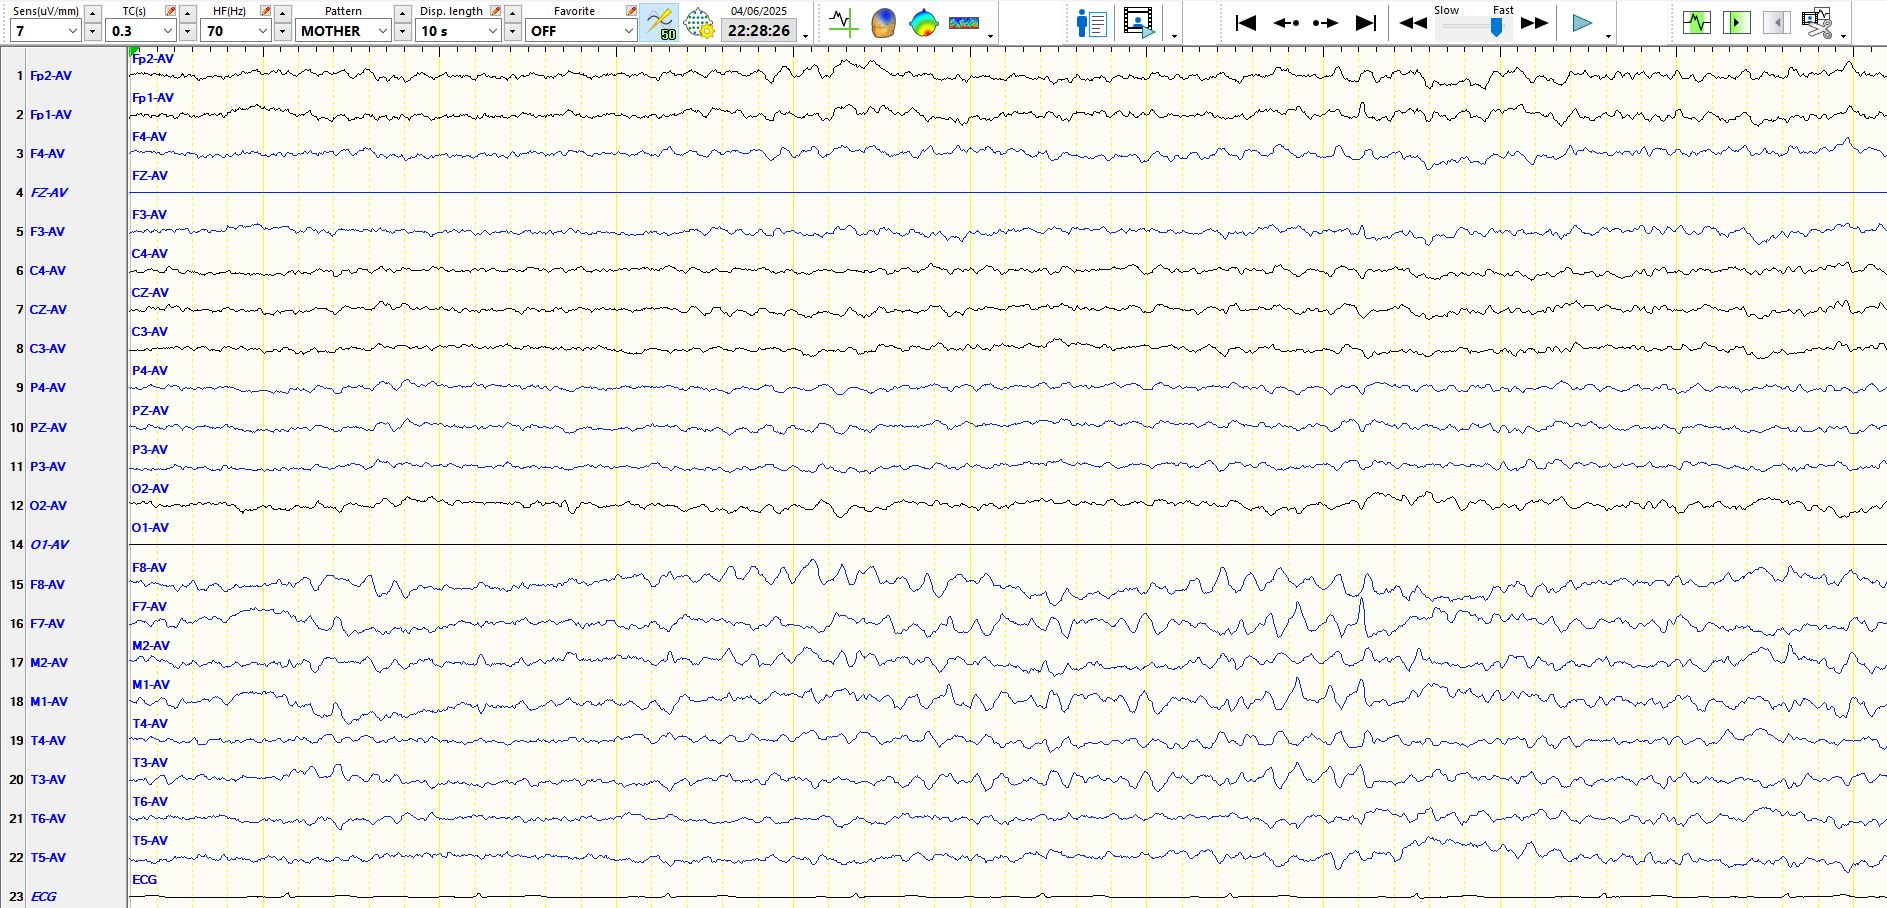
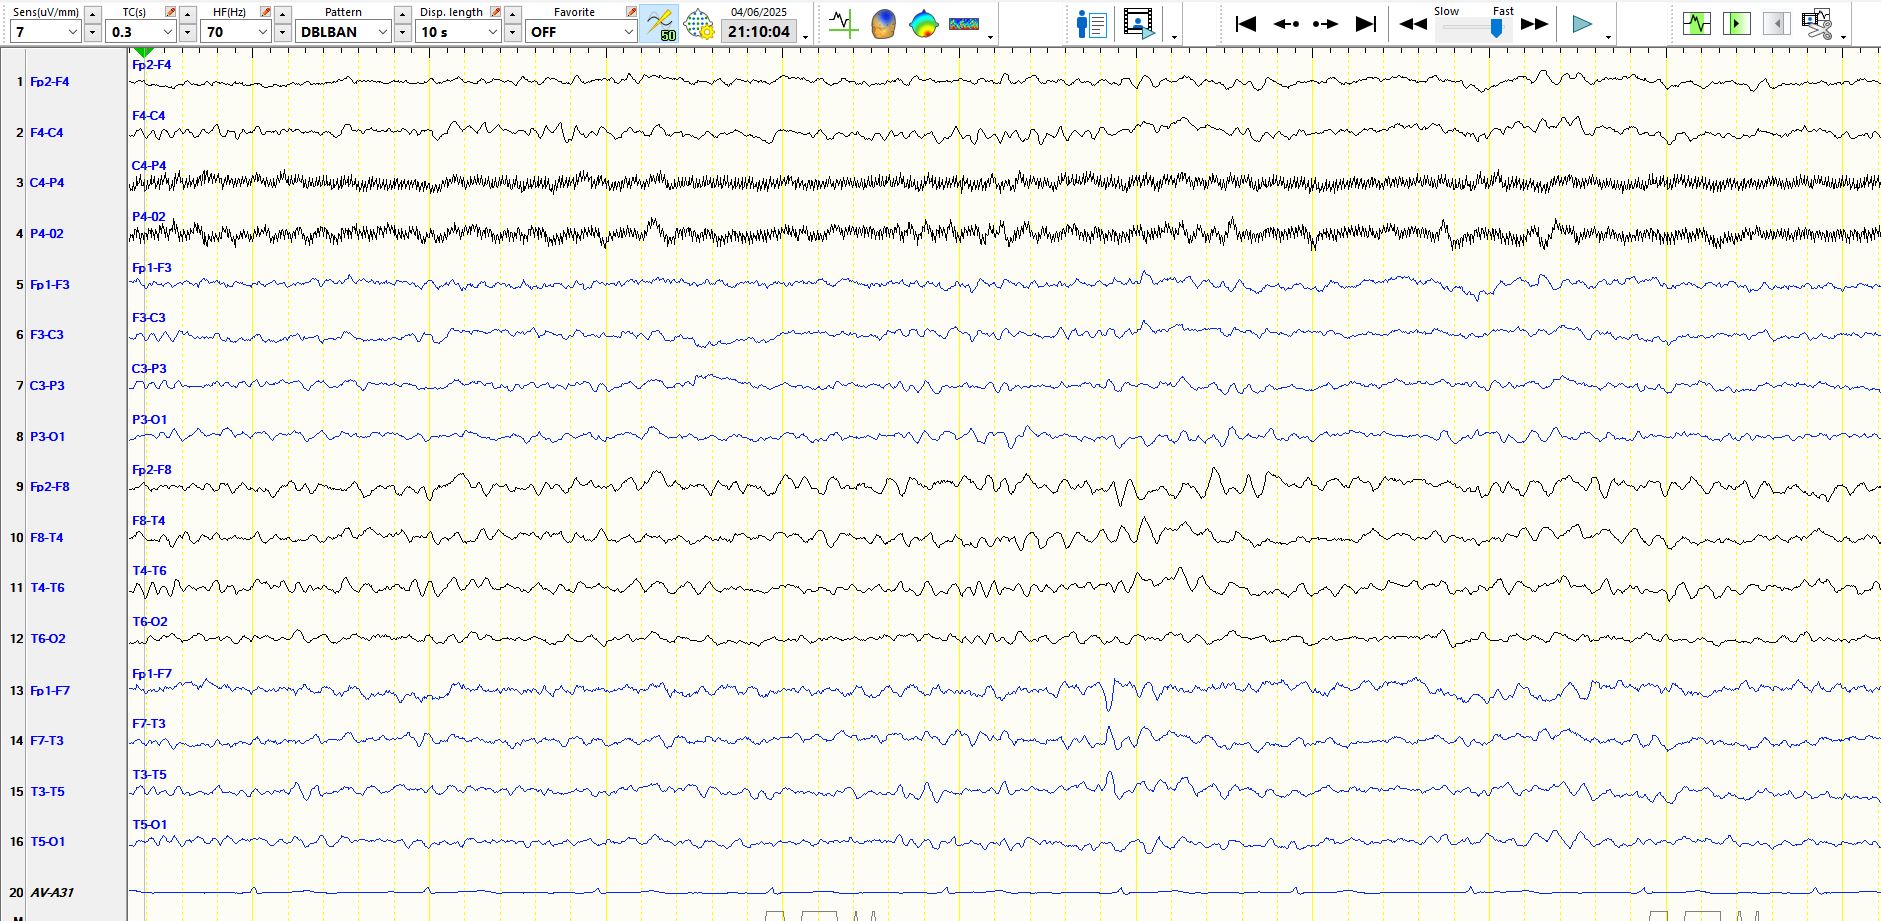
In the page above, notice how well-developed alpha is over the temporal regions, especially on the left, in the first few seconds of the page
Figure 2:
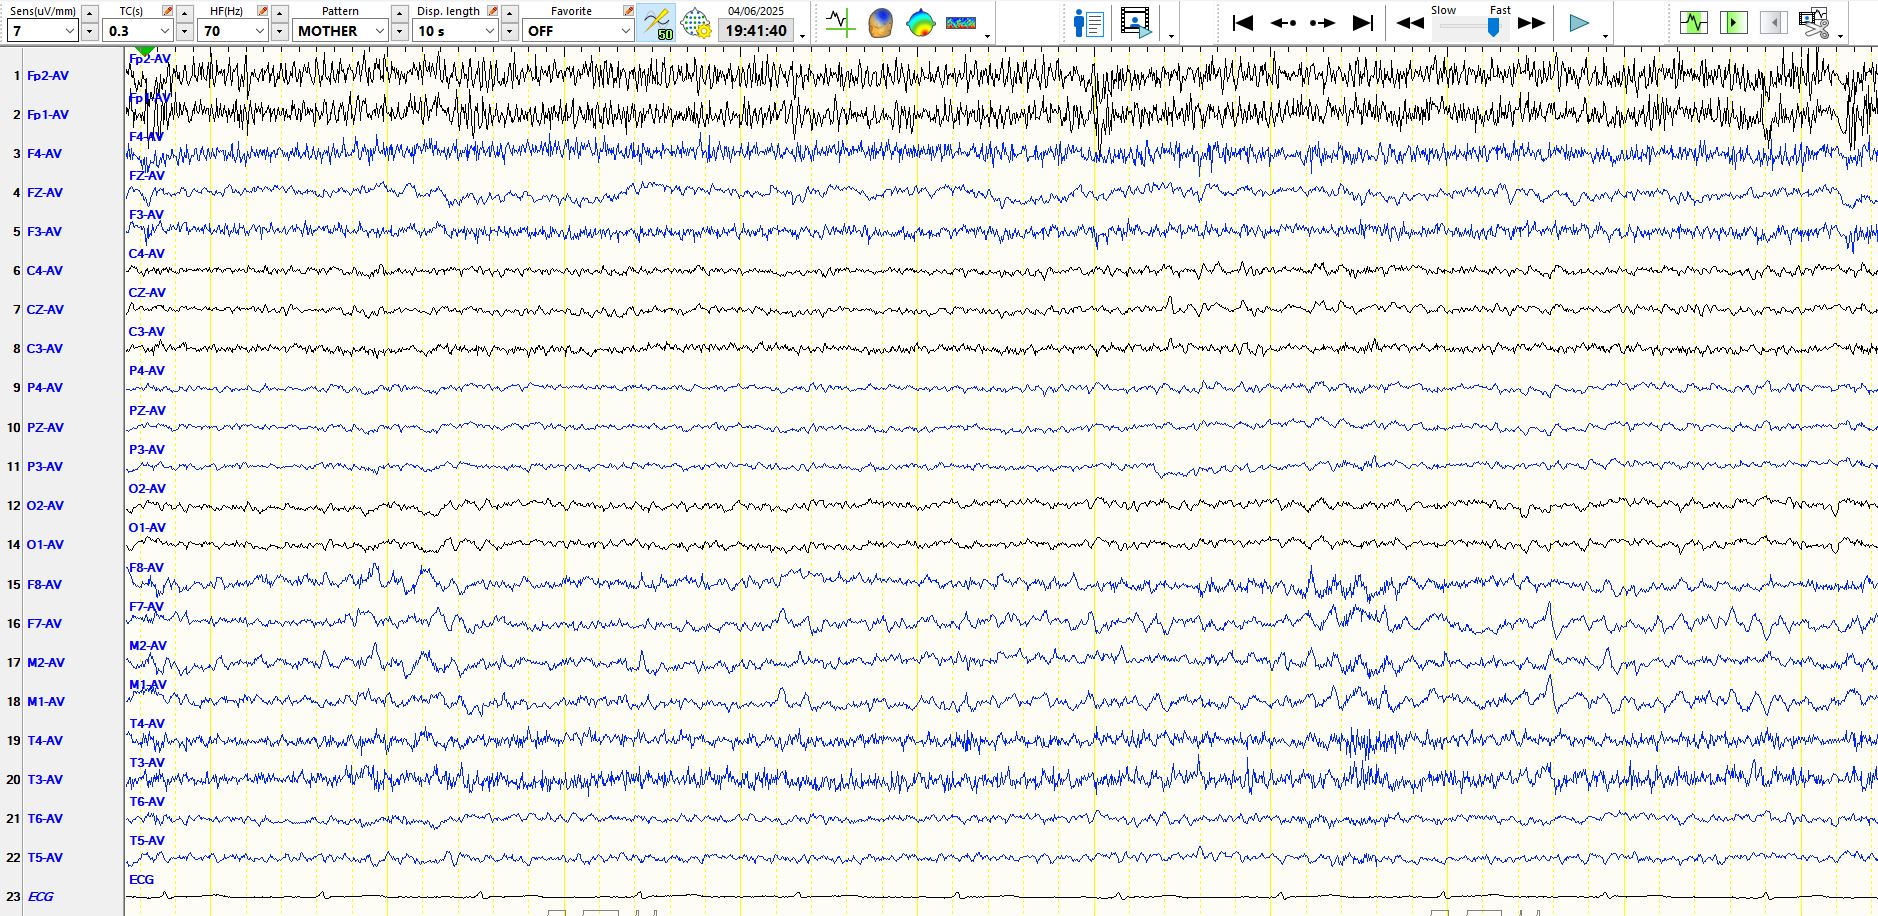
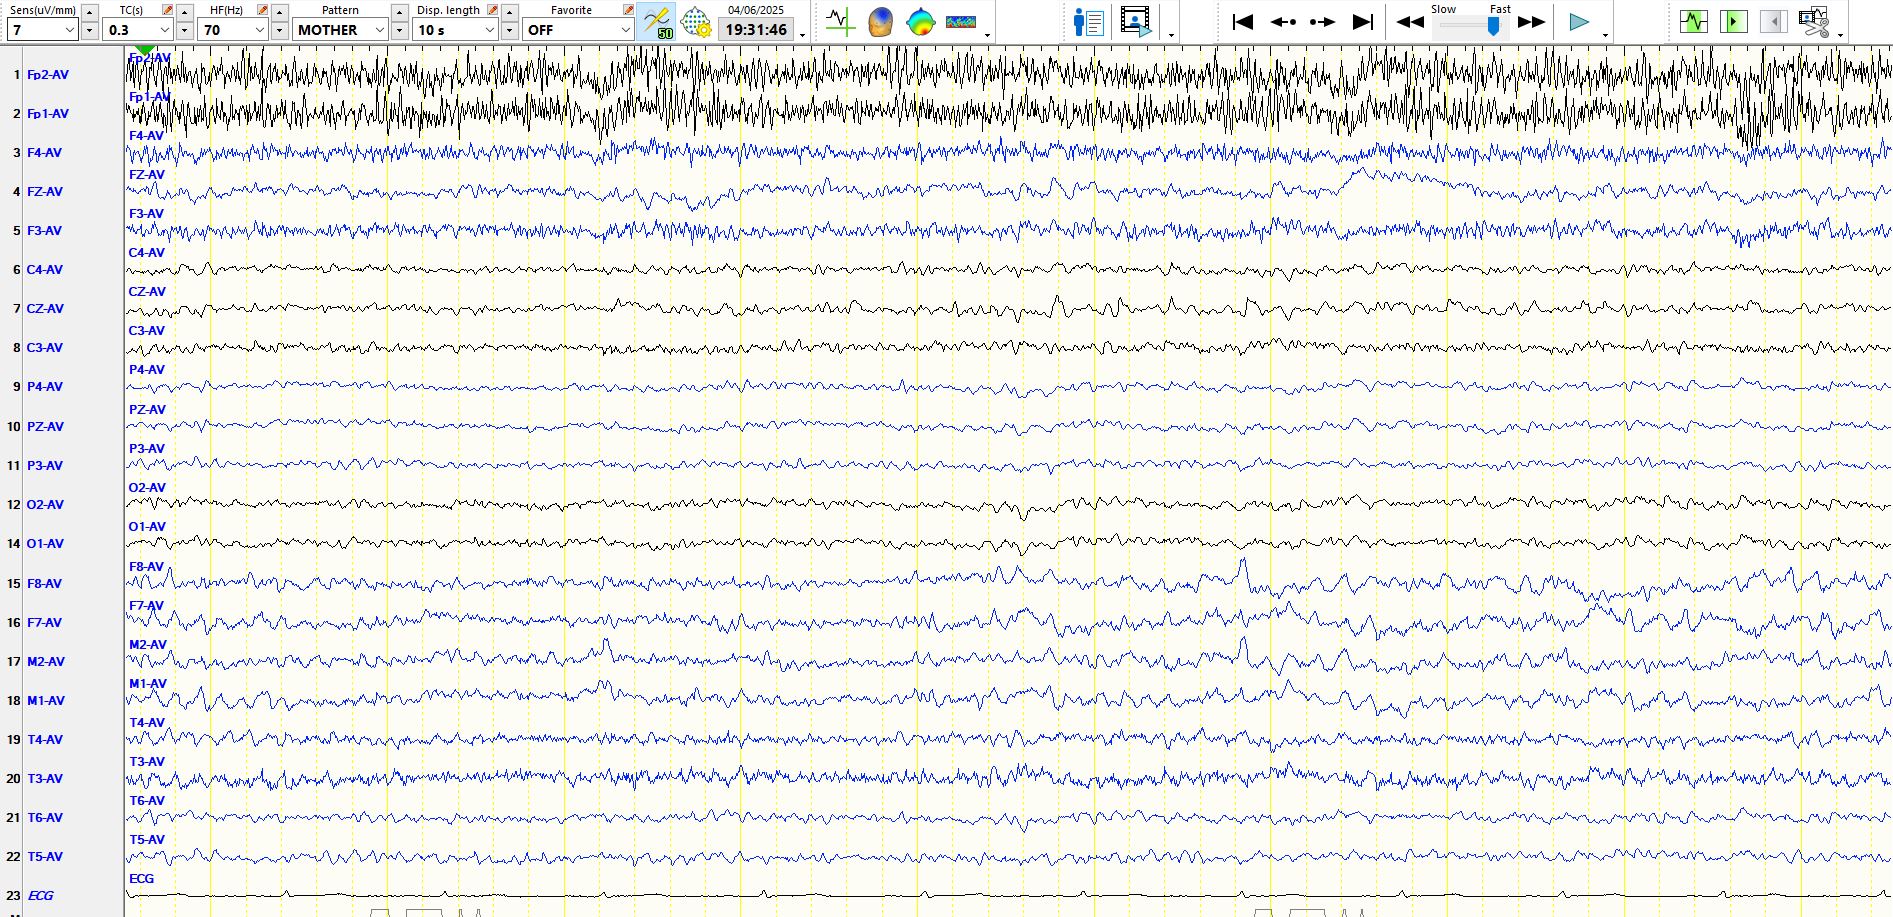
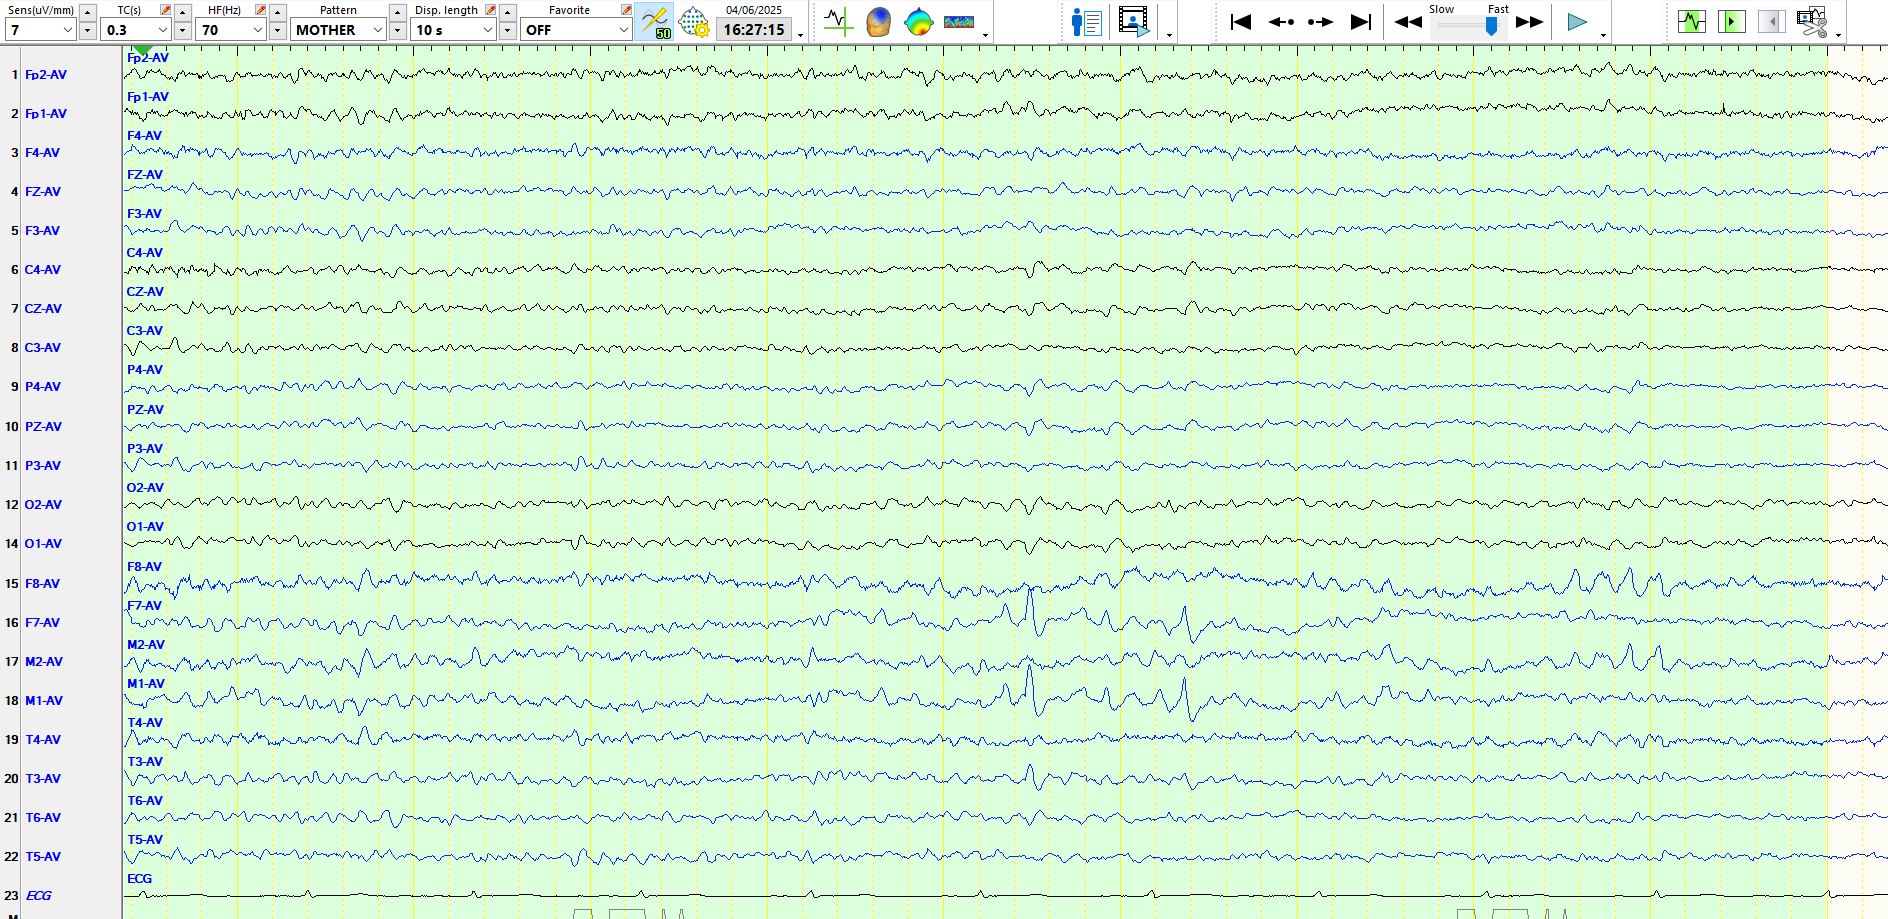
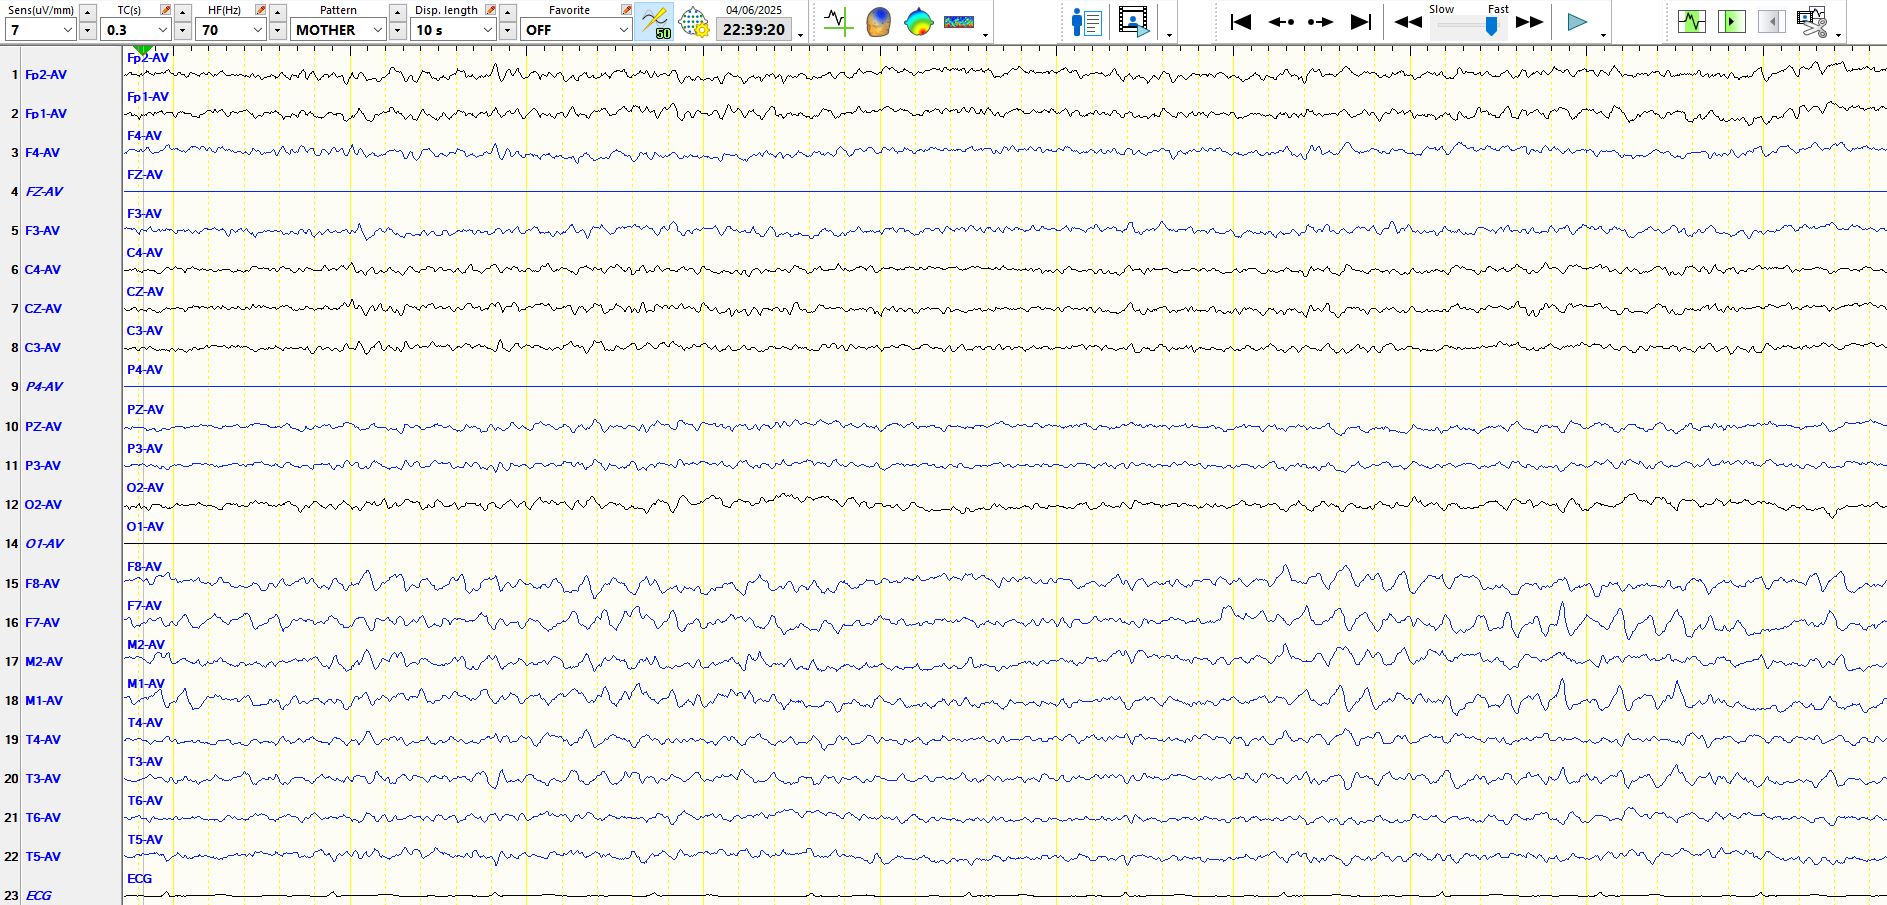
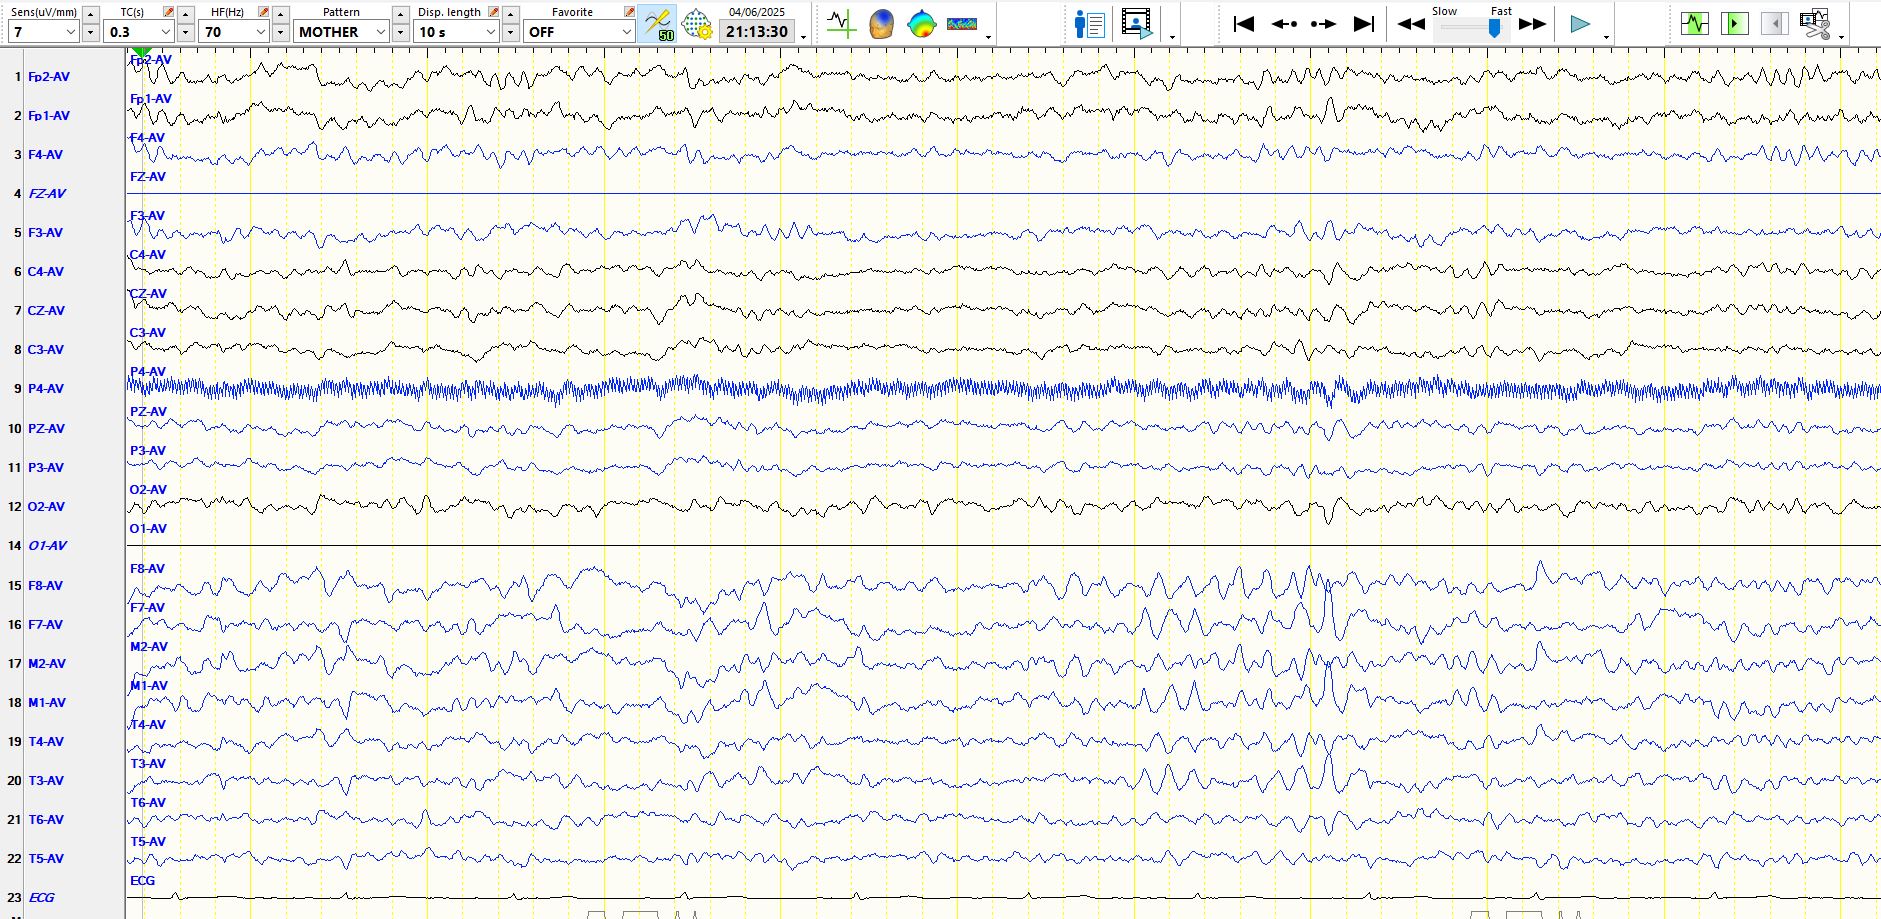
In the first few seconds of the page above there are a few theta waves at F8-M2; asymmetric theta waves are not unusual during the early stages of drowsiness. On the right hand side of the page, just to the right of the temporal EMG artifact there is a sharpish waved at F7-M1-T3. There is no after-coming slow-wave and the amplitude is not especially different from the background rhythms. The descent of the wave quite steep, but given the other features described above, you would be well advised not to regard this as a sharp wave or spike. As you will see below, wicket waves may have this appearance
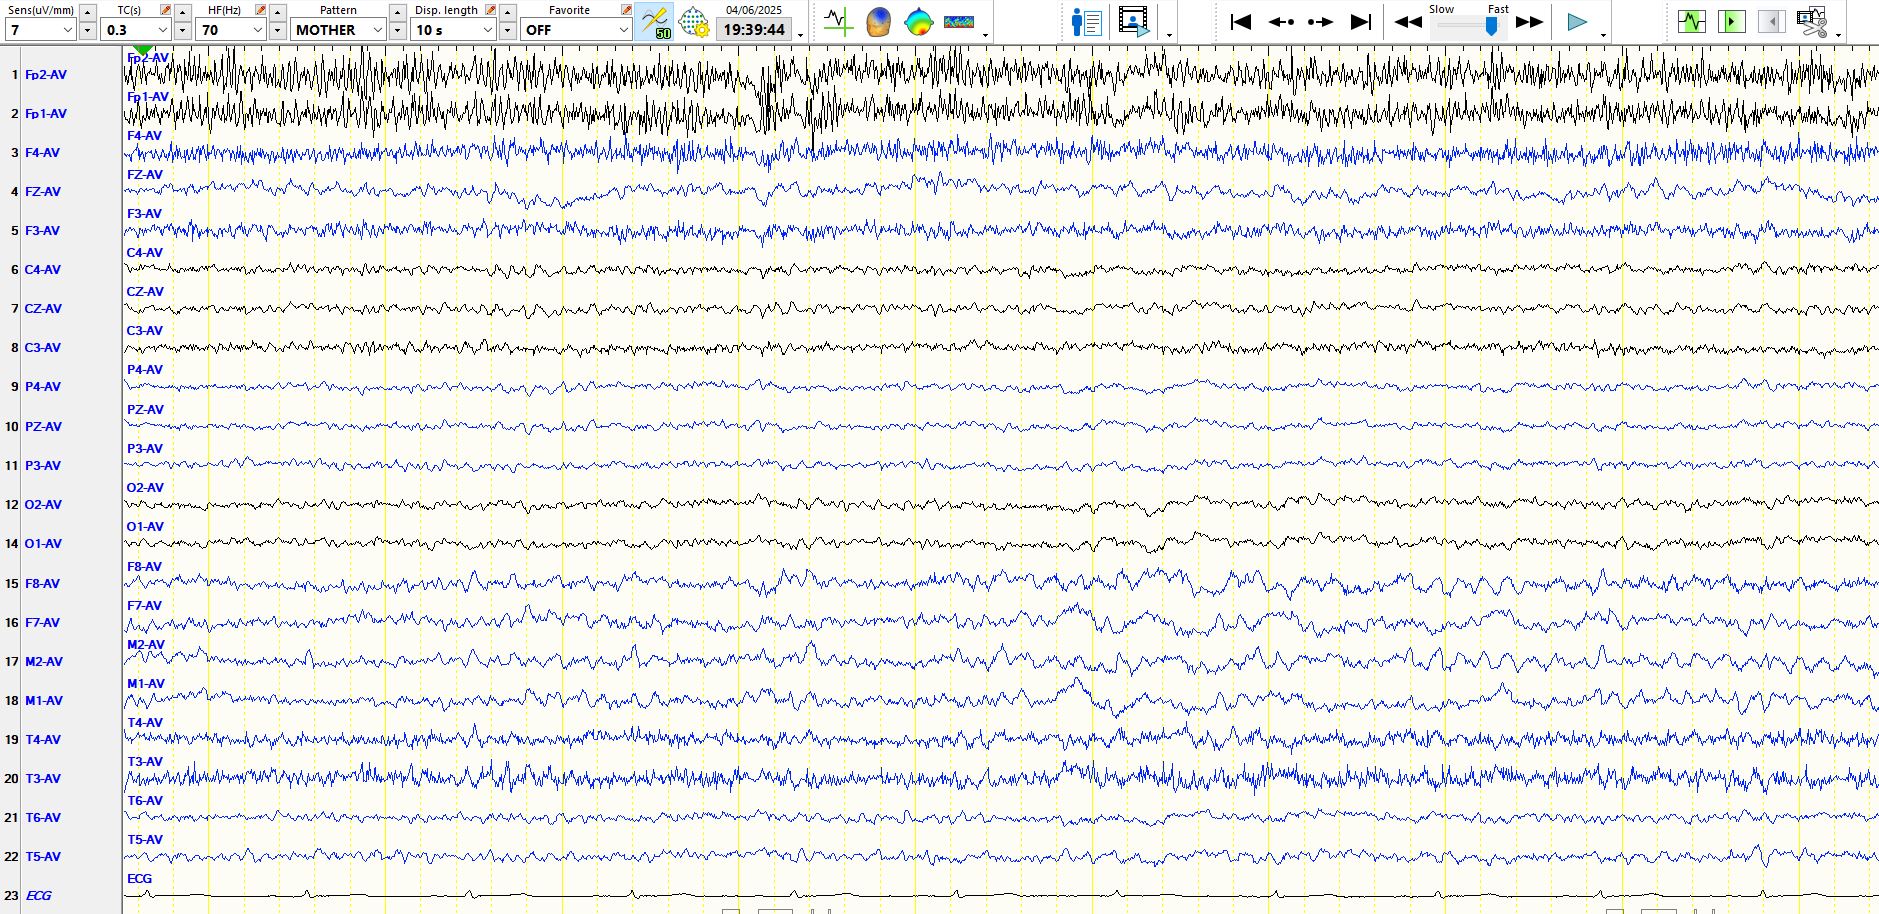
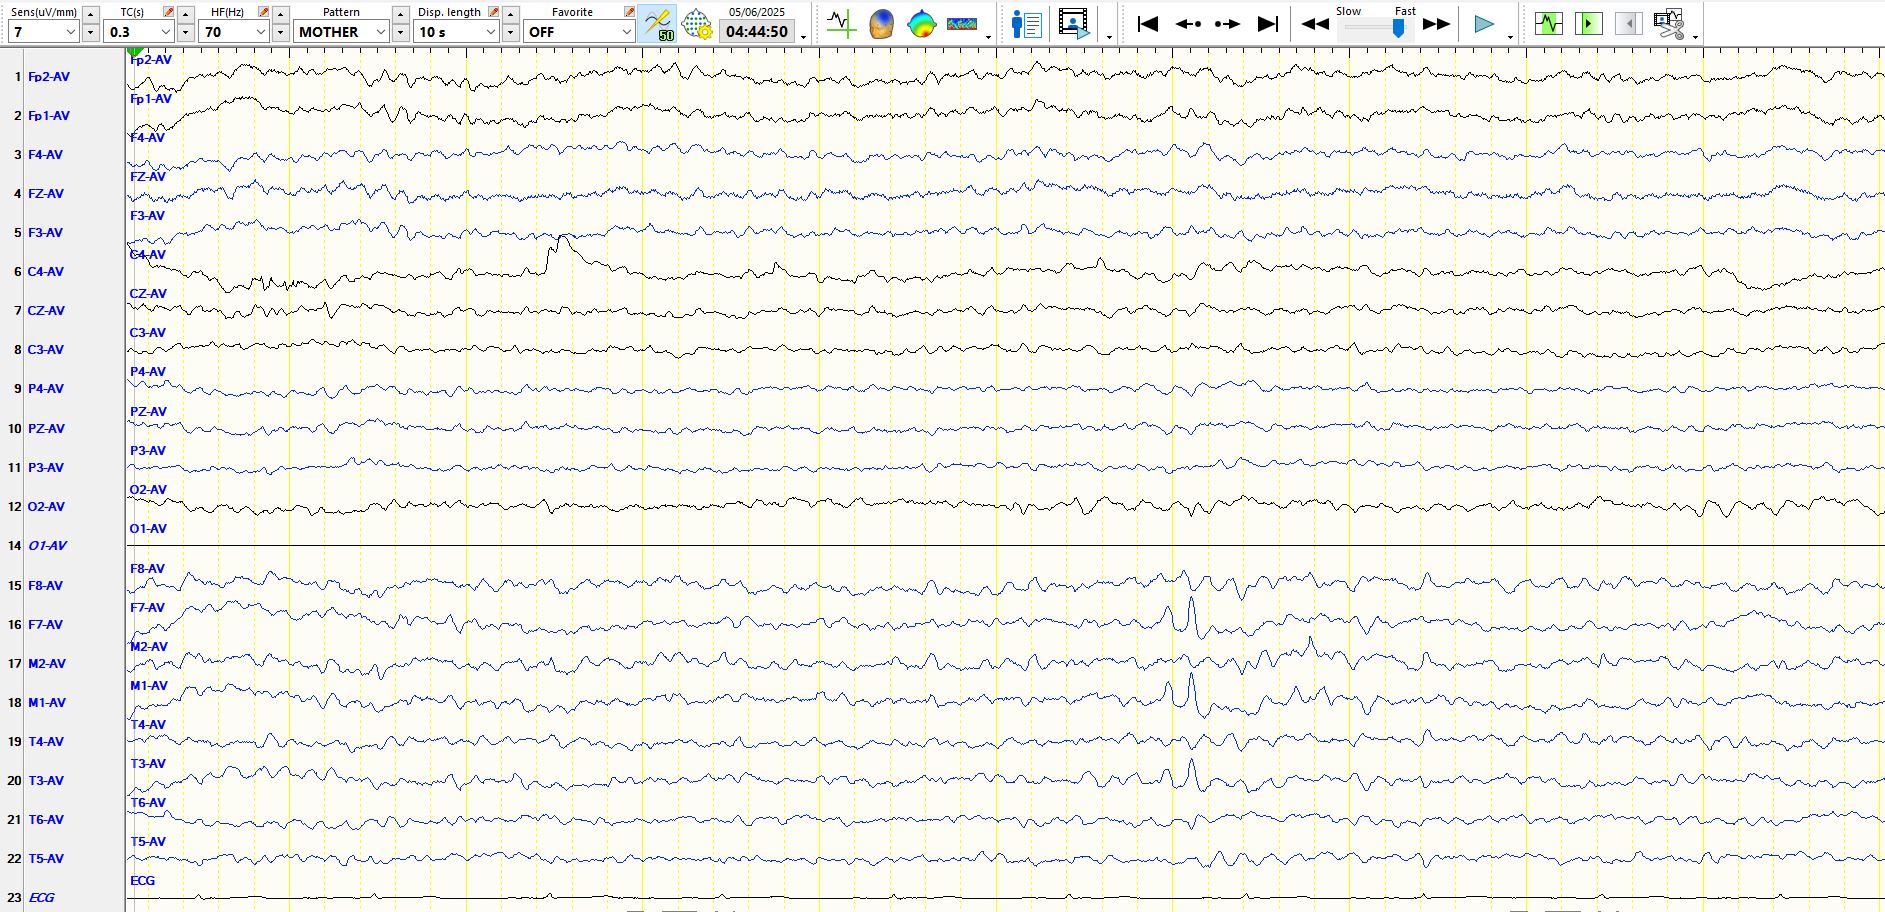
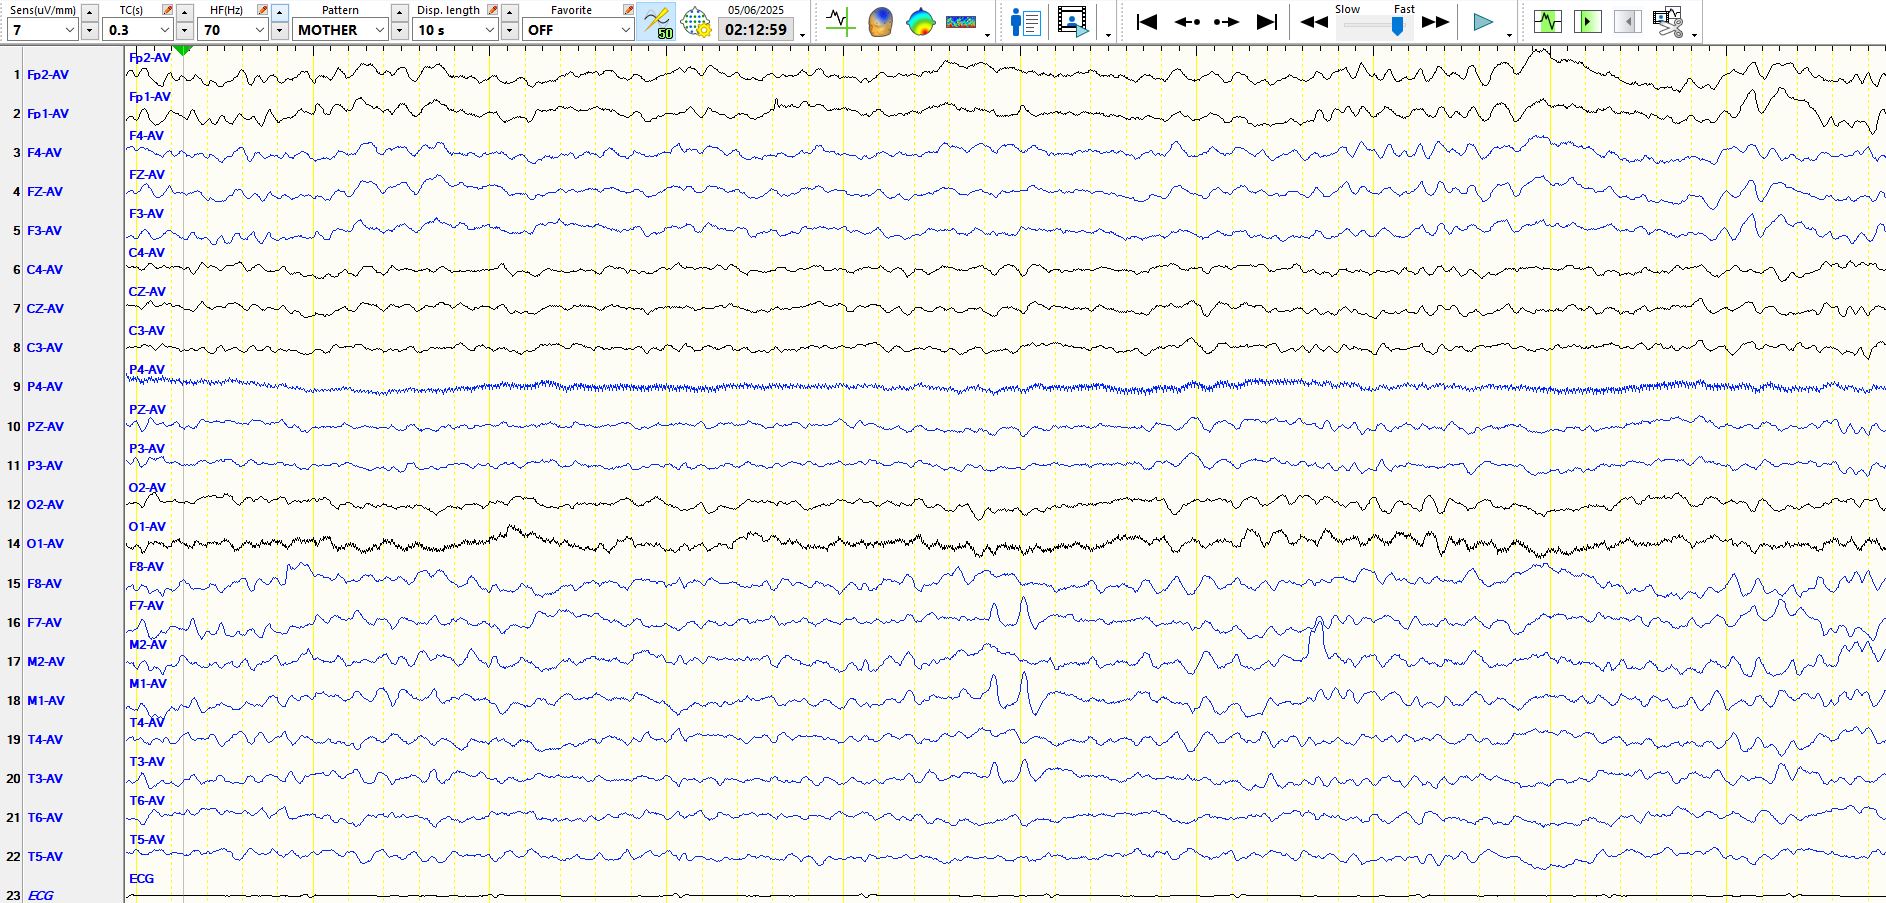
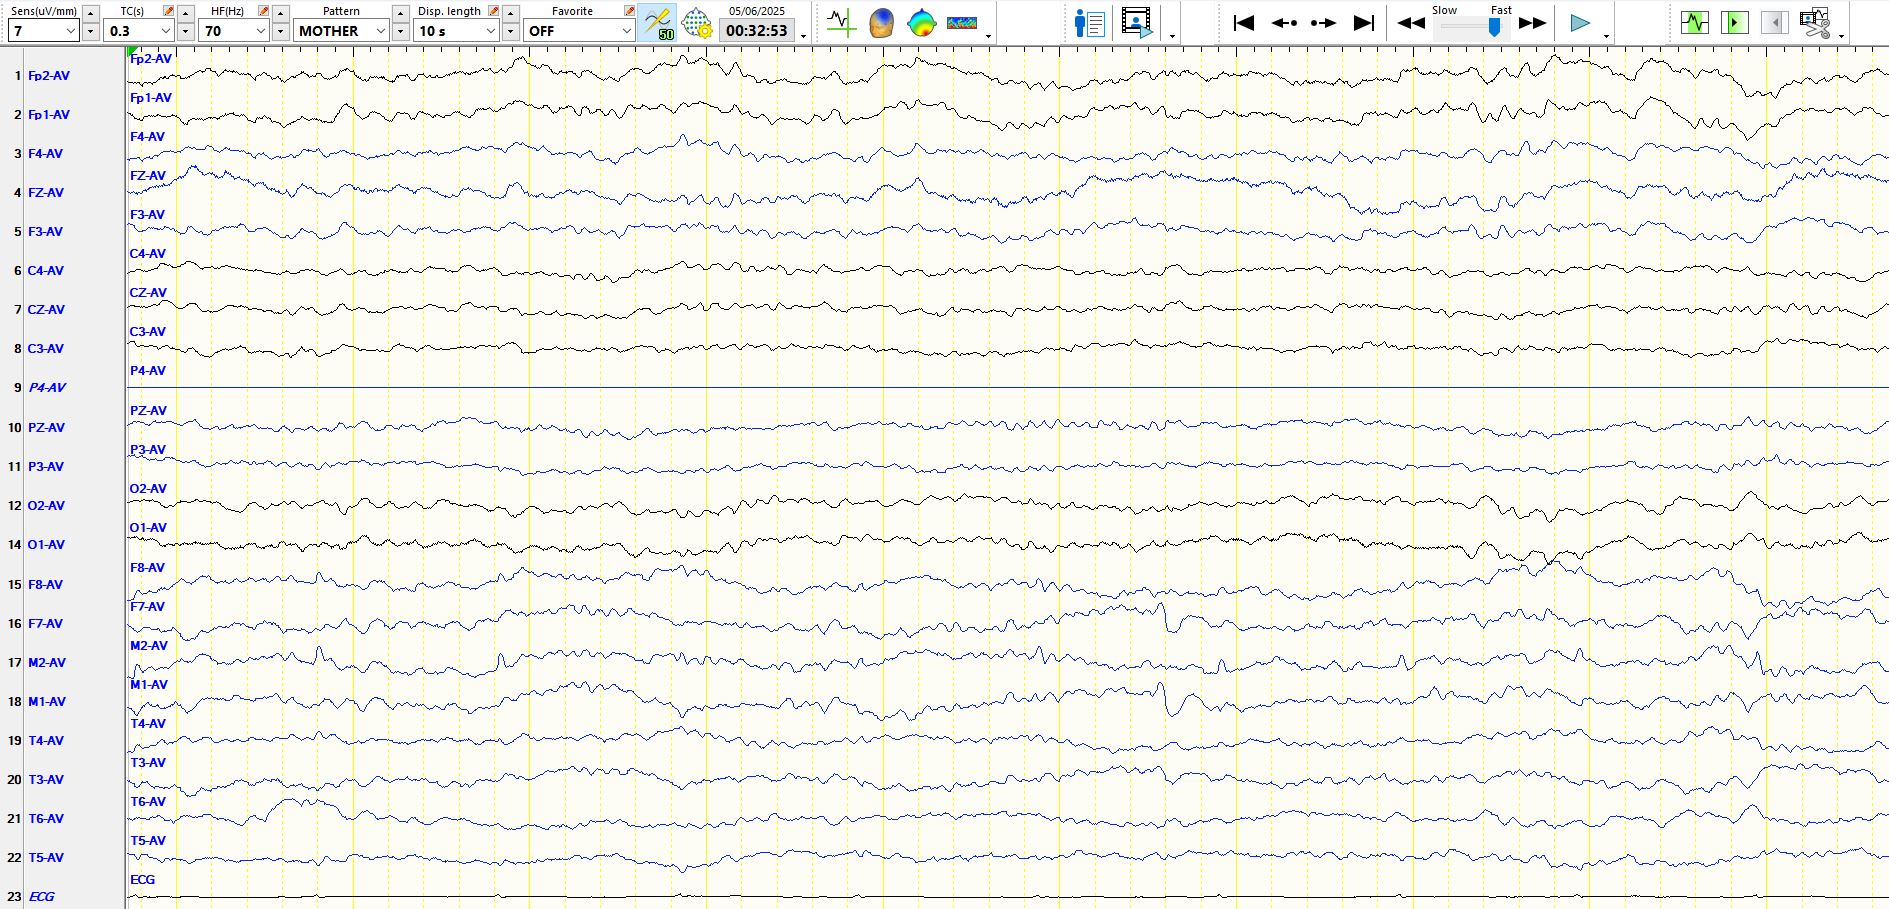
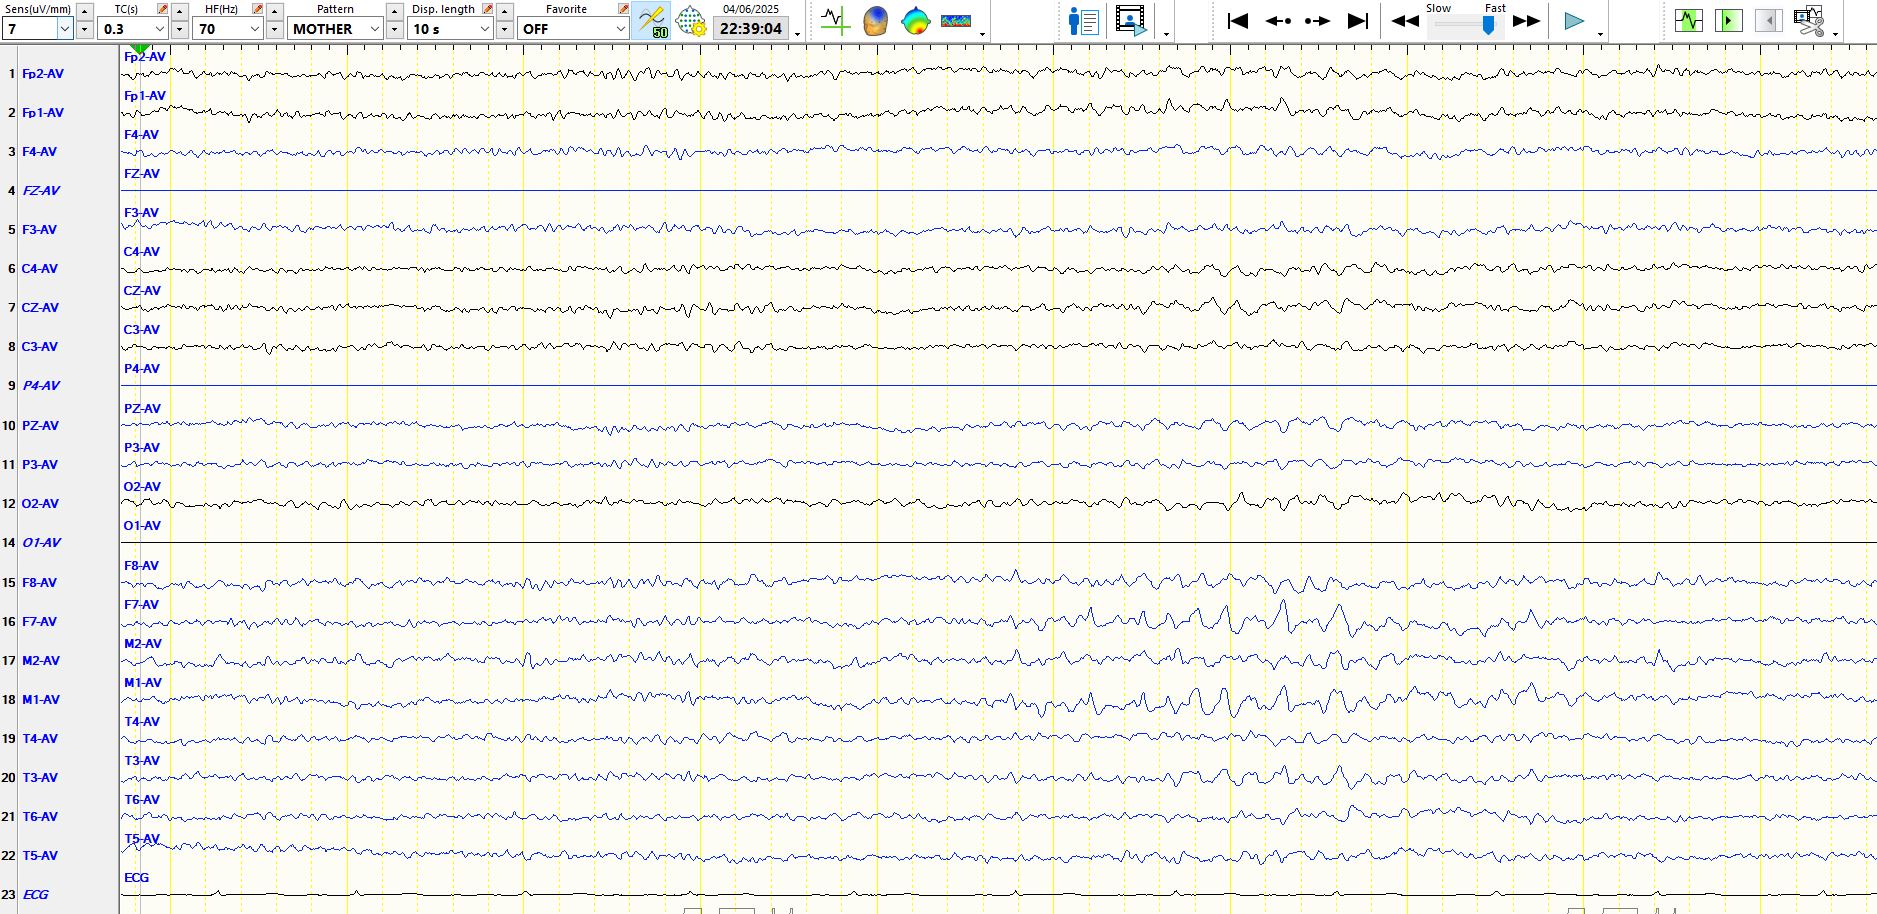
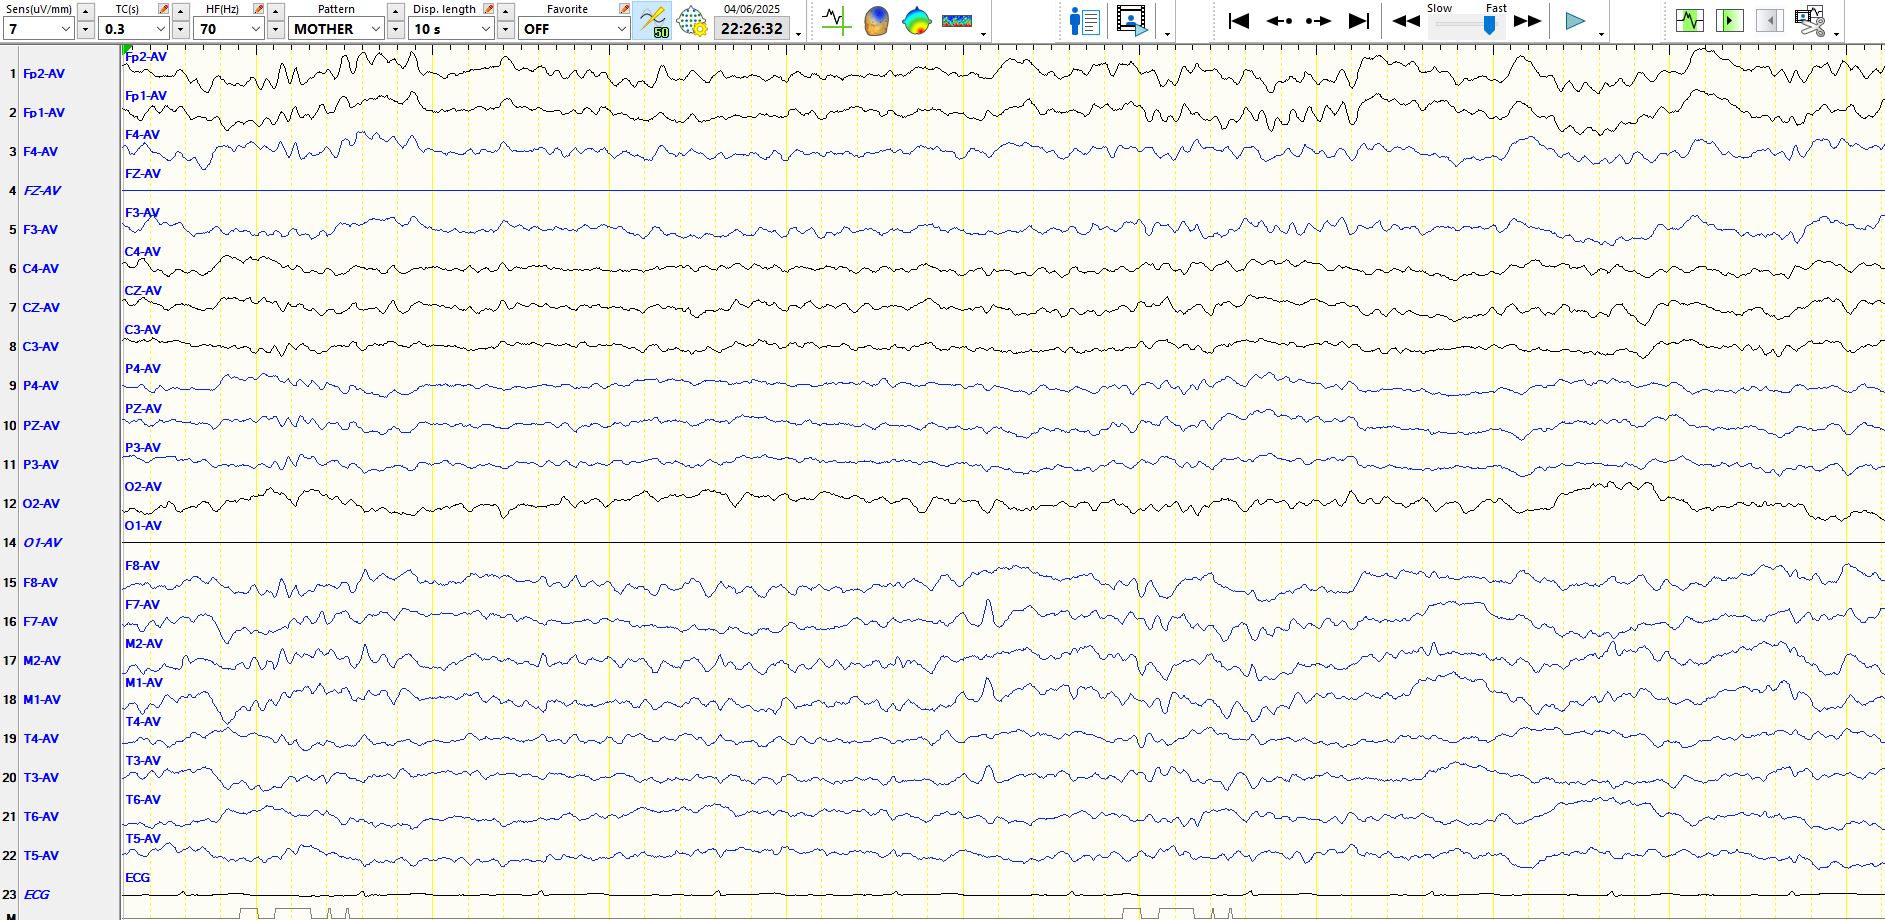
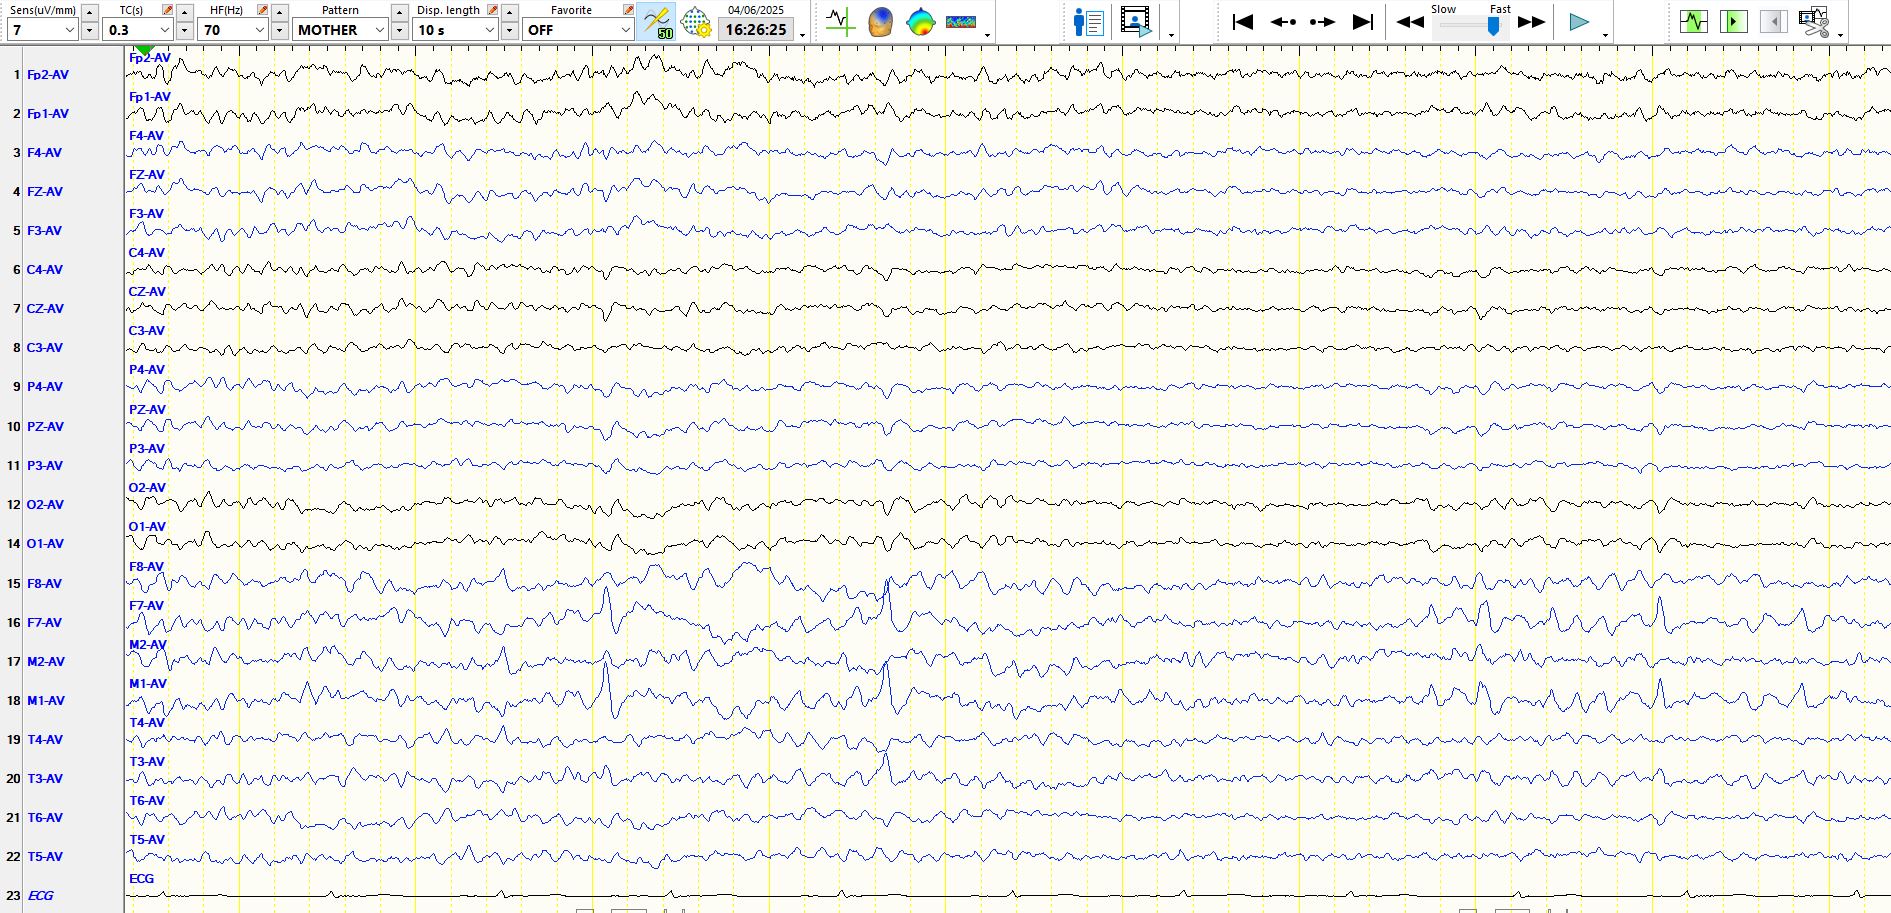
The page above shows that the patient is drowsy, but there are sequential delta waves at F7-M1-T3, indicative of non-epileptiform dysfunction over the left anterior, inferior temporal region
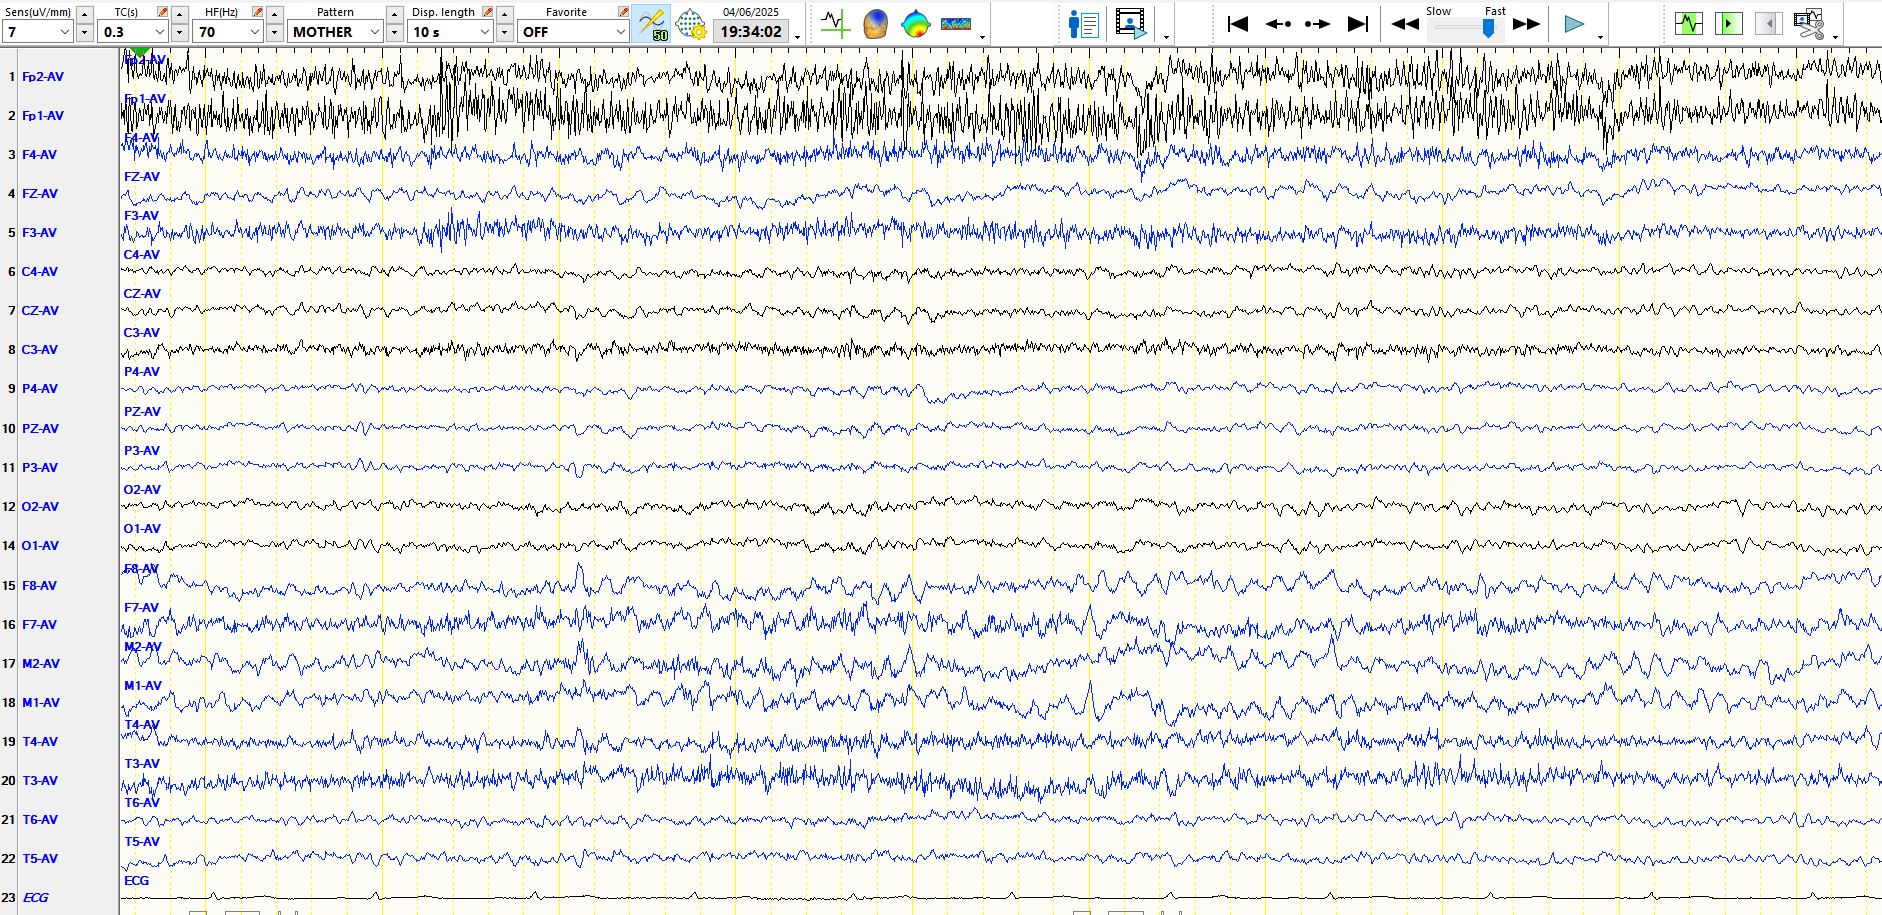
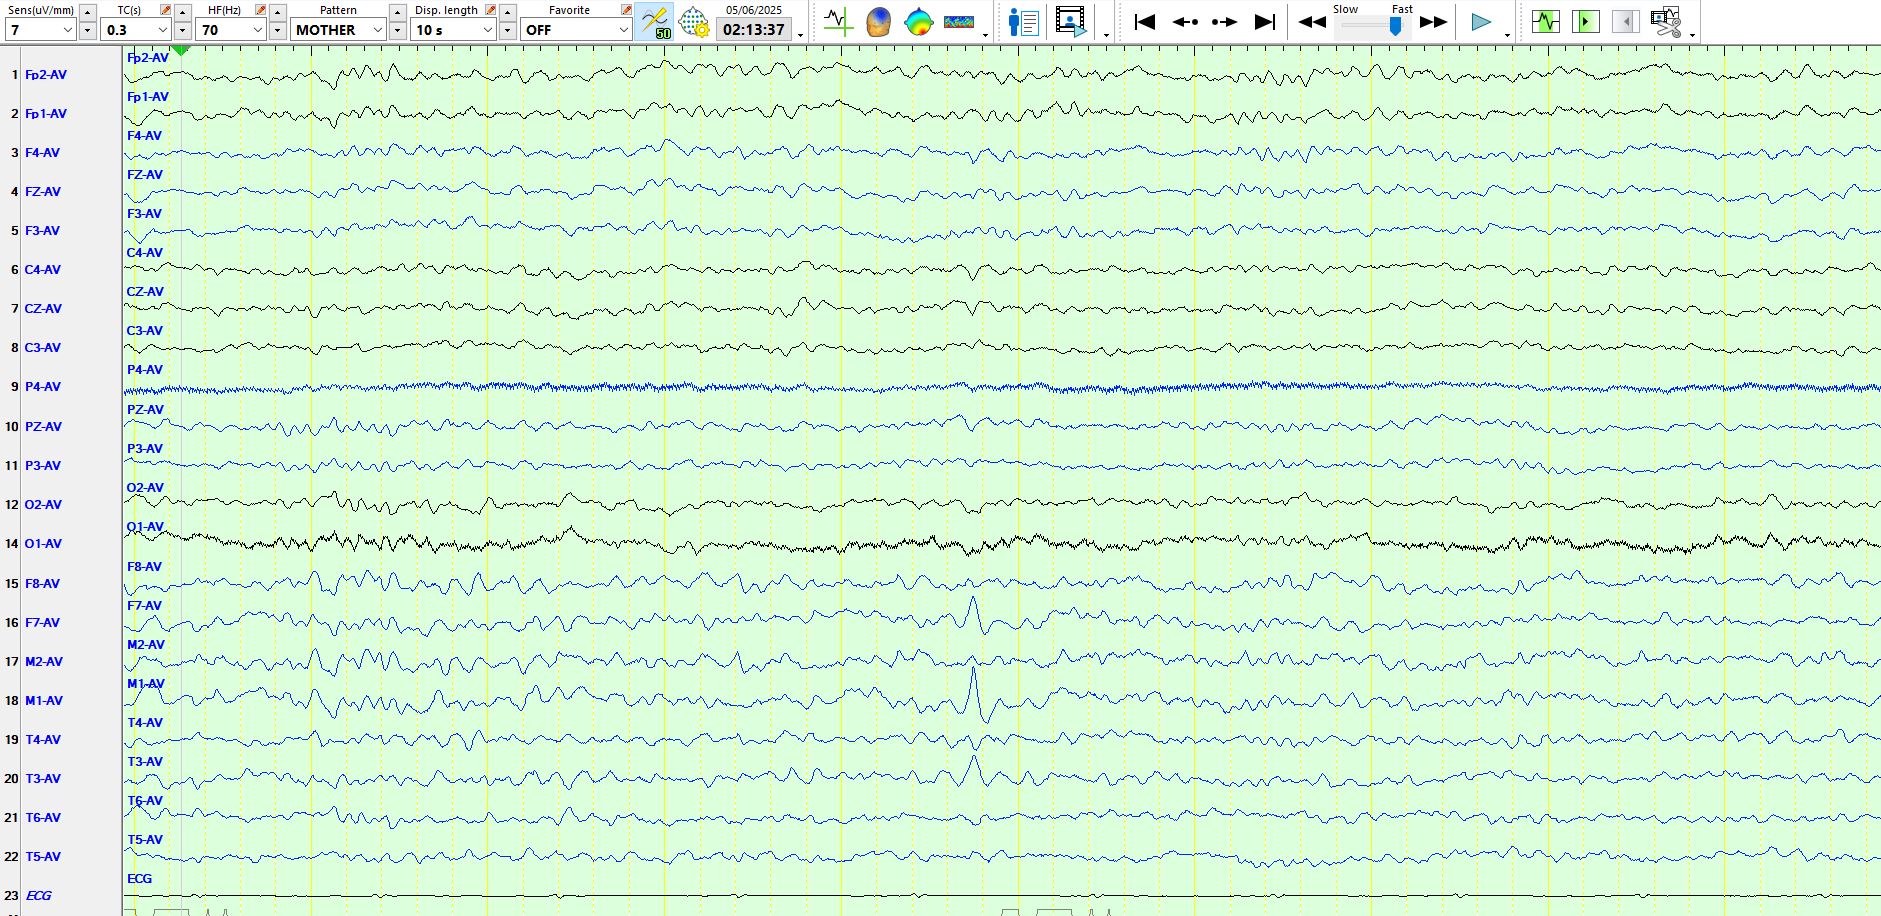
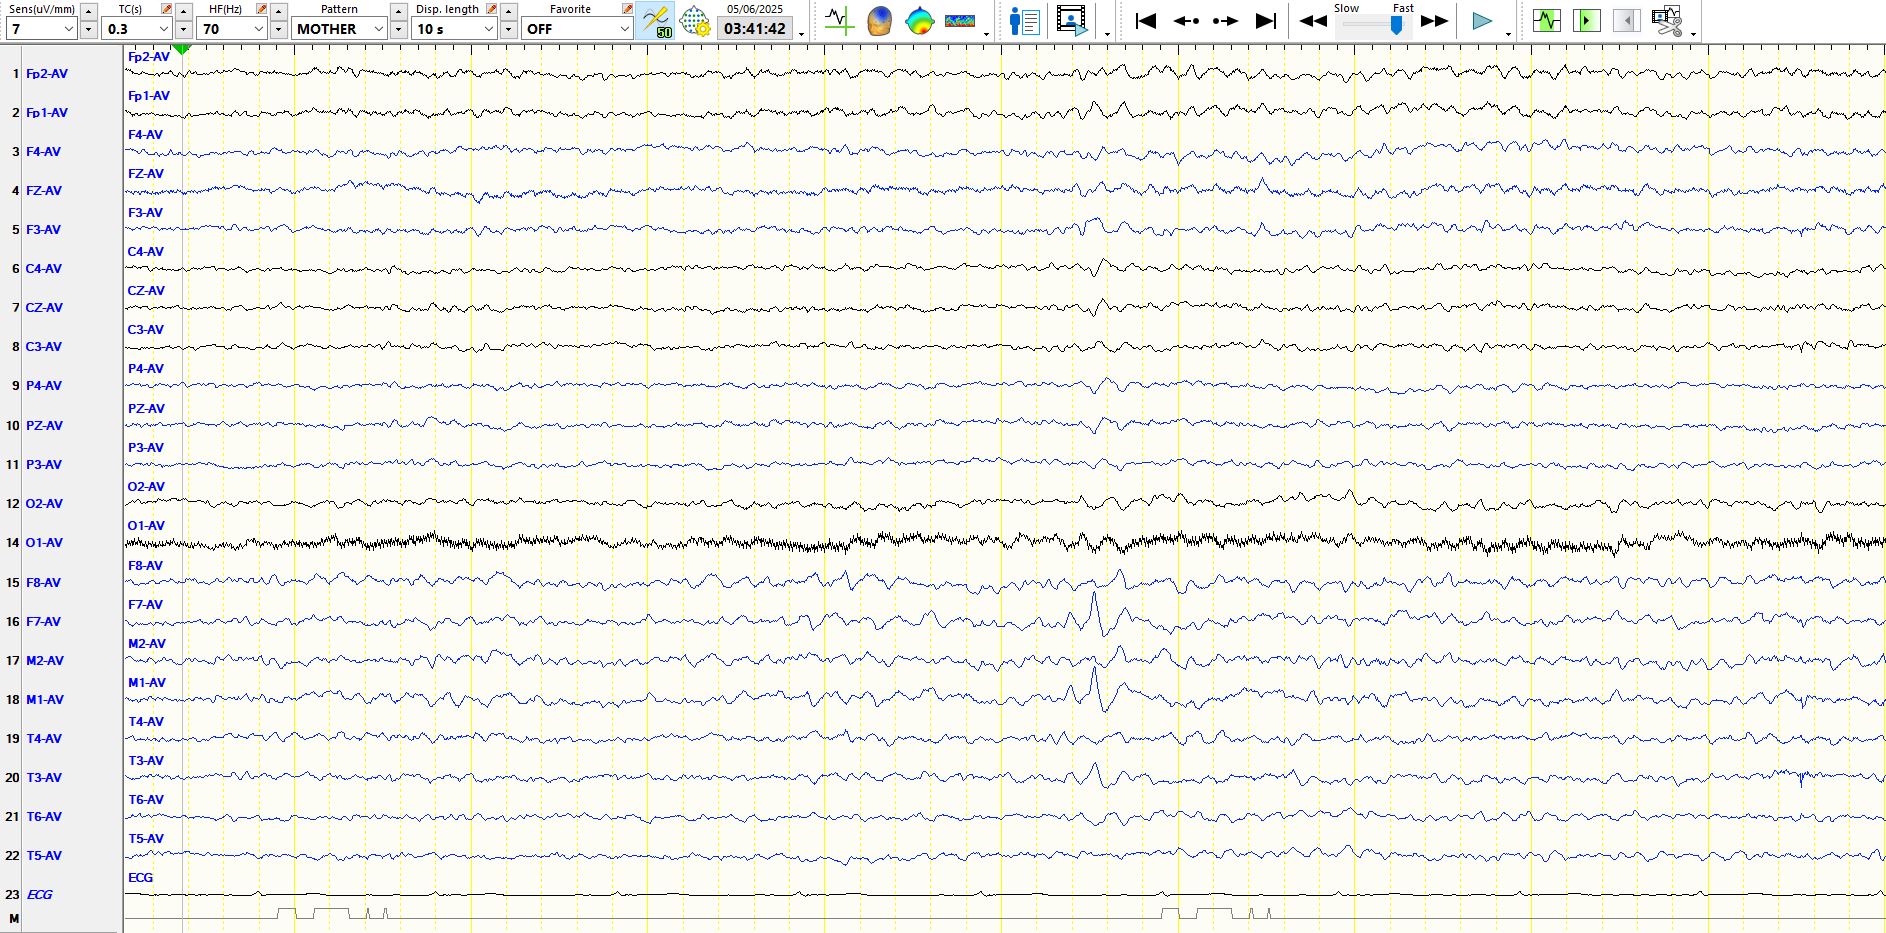
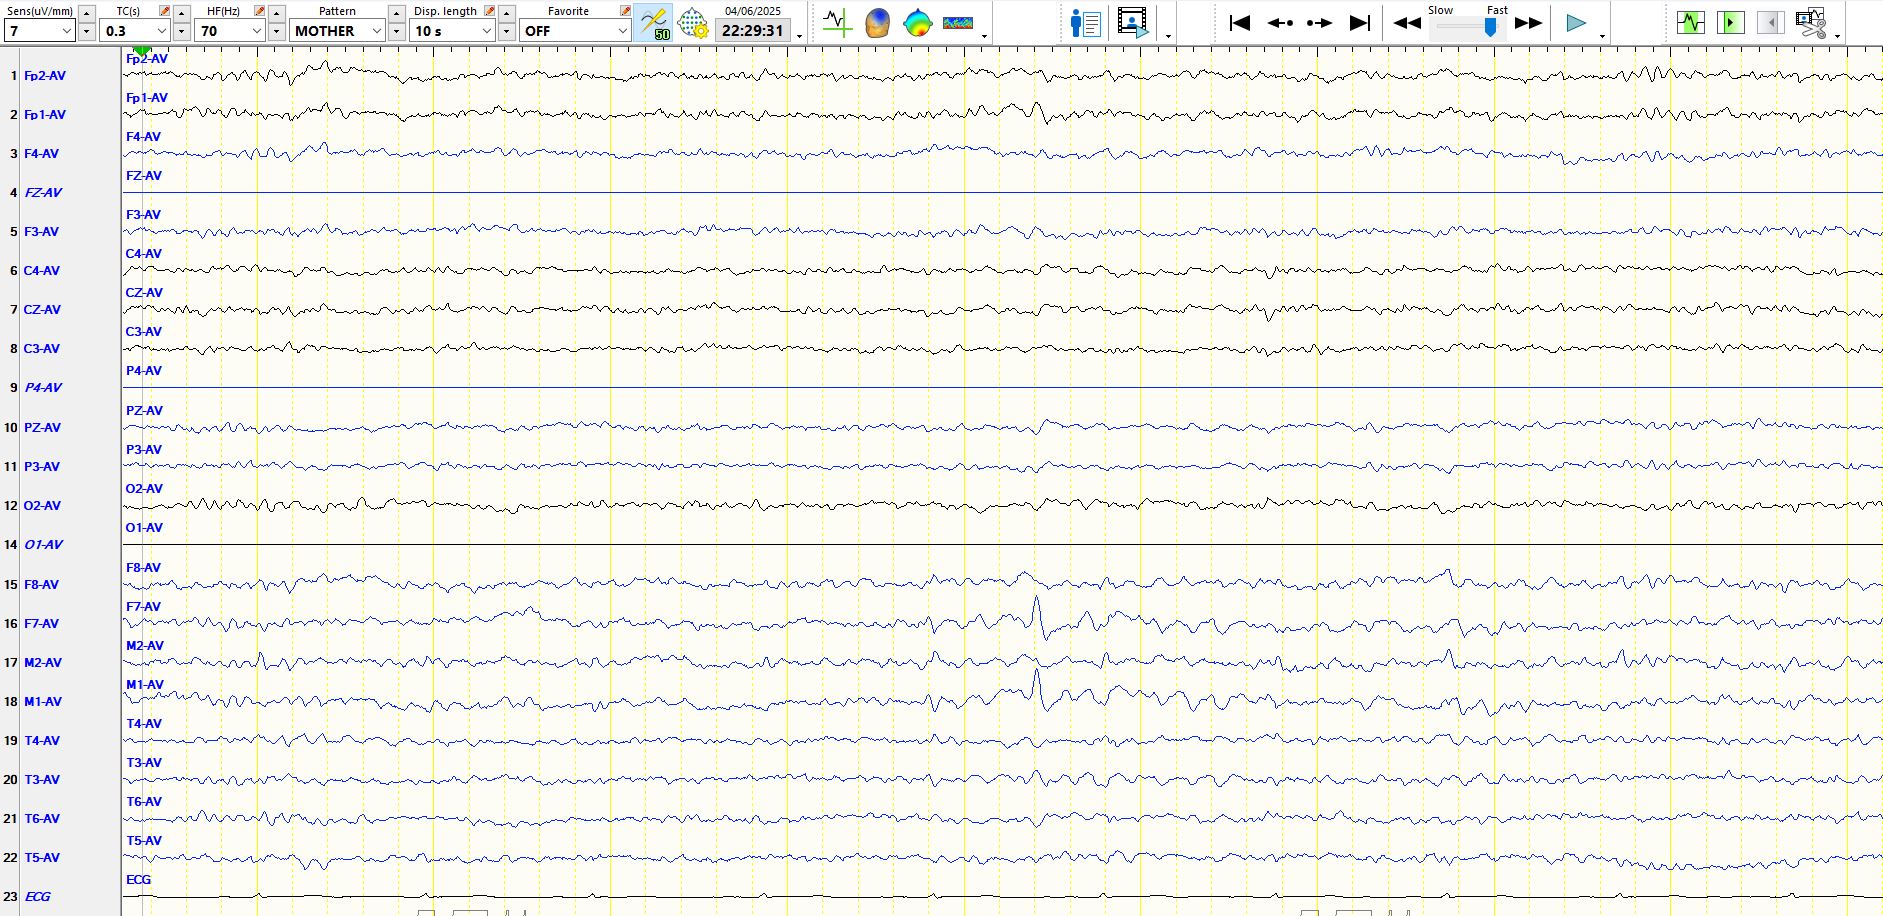
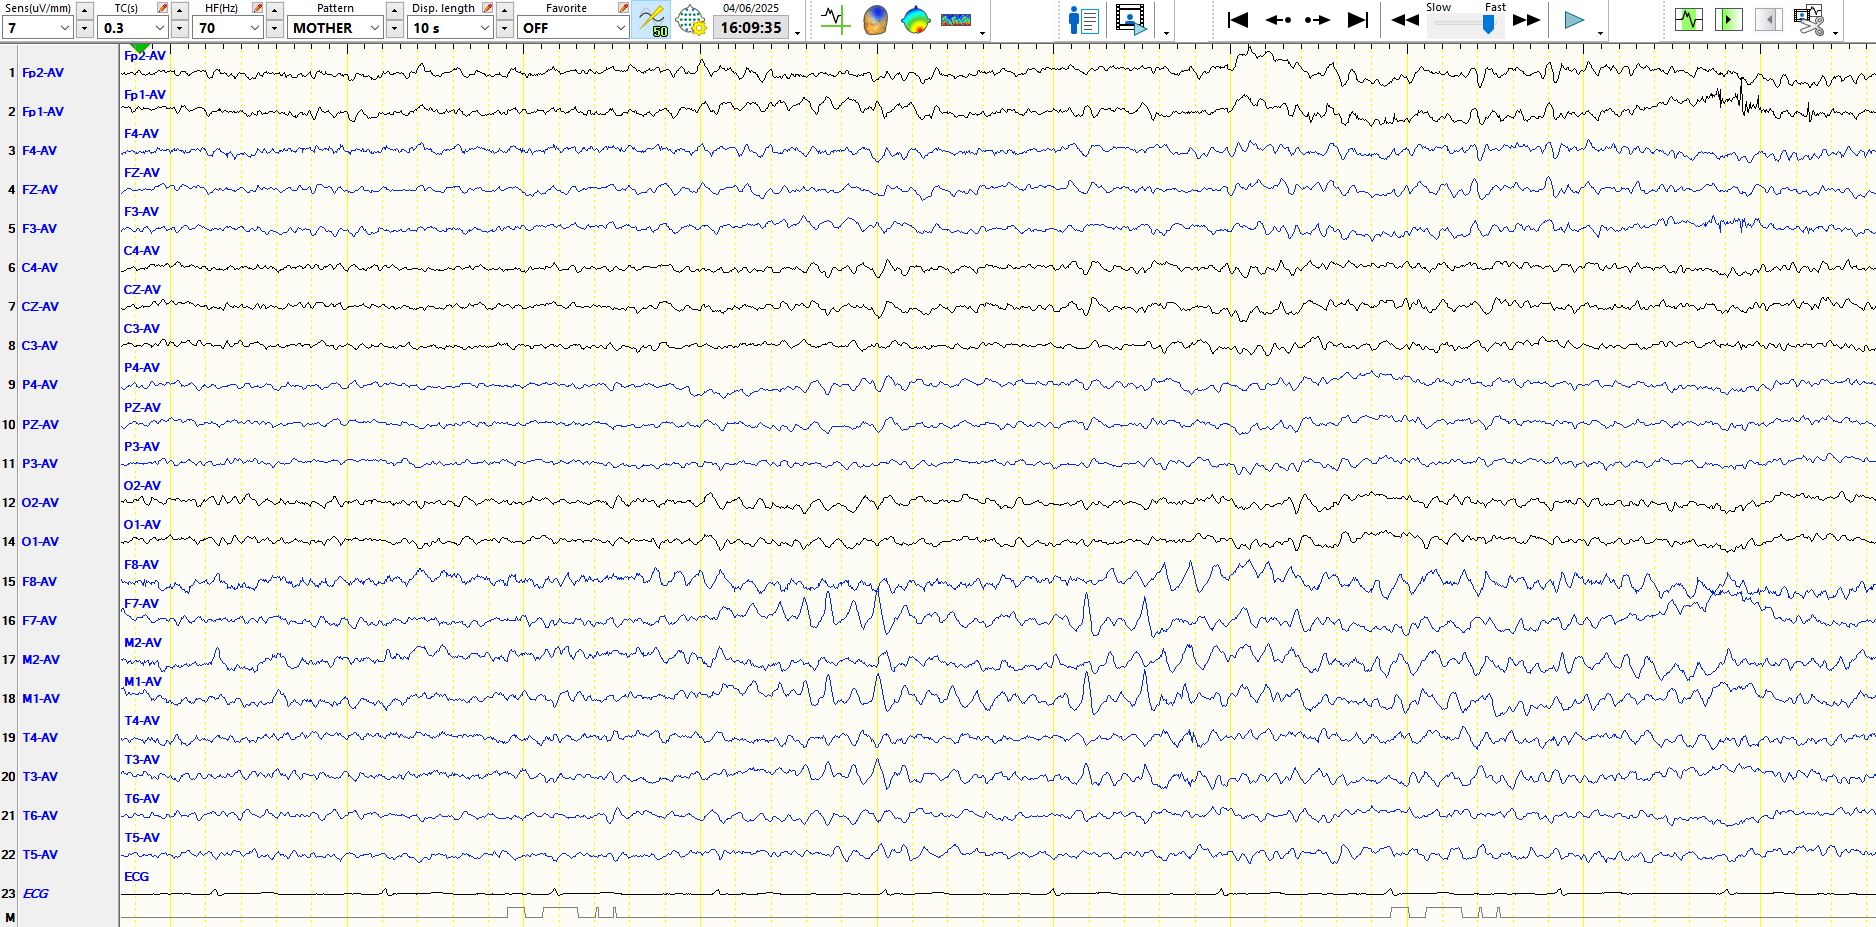
The page above demonstrates a single delta wave at M1-F7, preceded by a sharp wave. However, this wave has the same shape as the background rhythms, is only minimally higher in amplitude than the background waves and, if you ignore the delta wave, you will appreciate that this sharply-contoured wave is part of a background rhythm that is progressively increasing in amplitude. Hence, you might get sucker-punched into calling this the spike-and-wave, when you would be well advised to call this a delta wave preceded by a wicket wave.
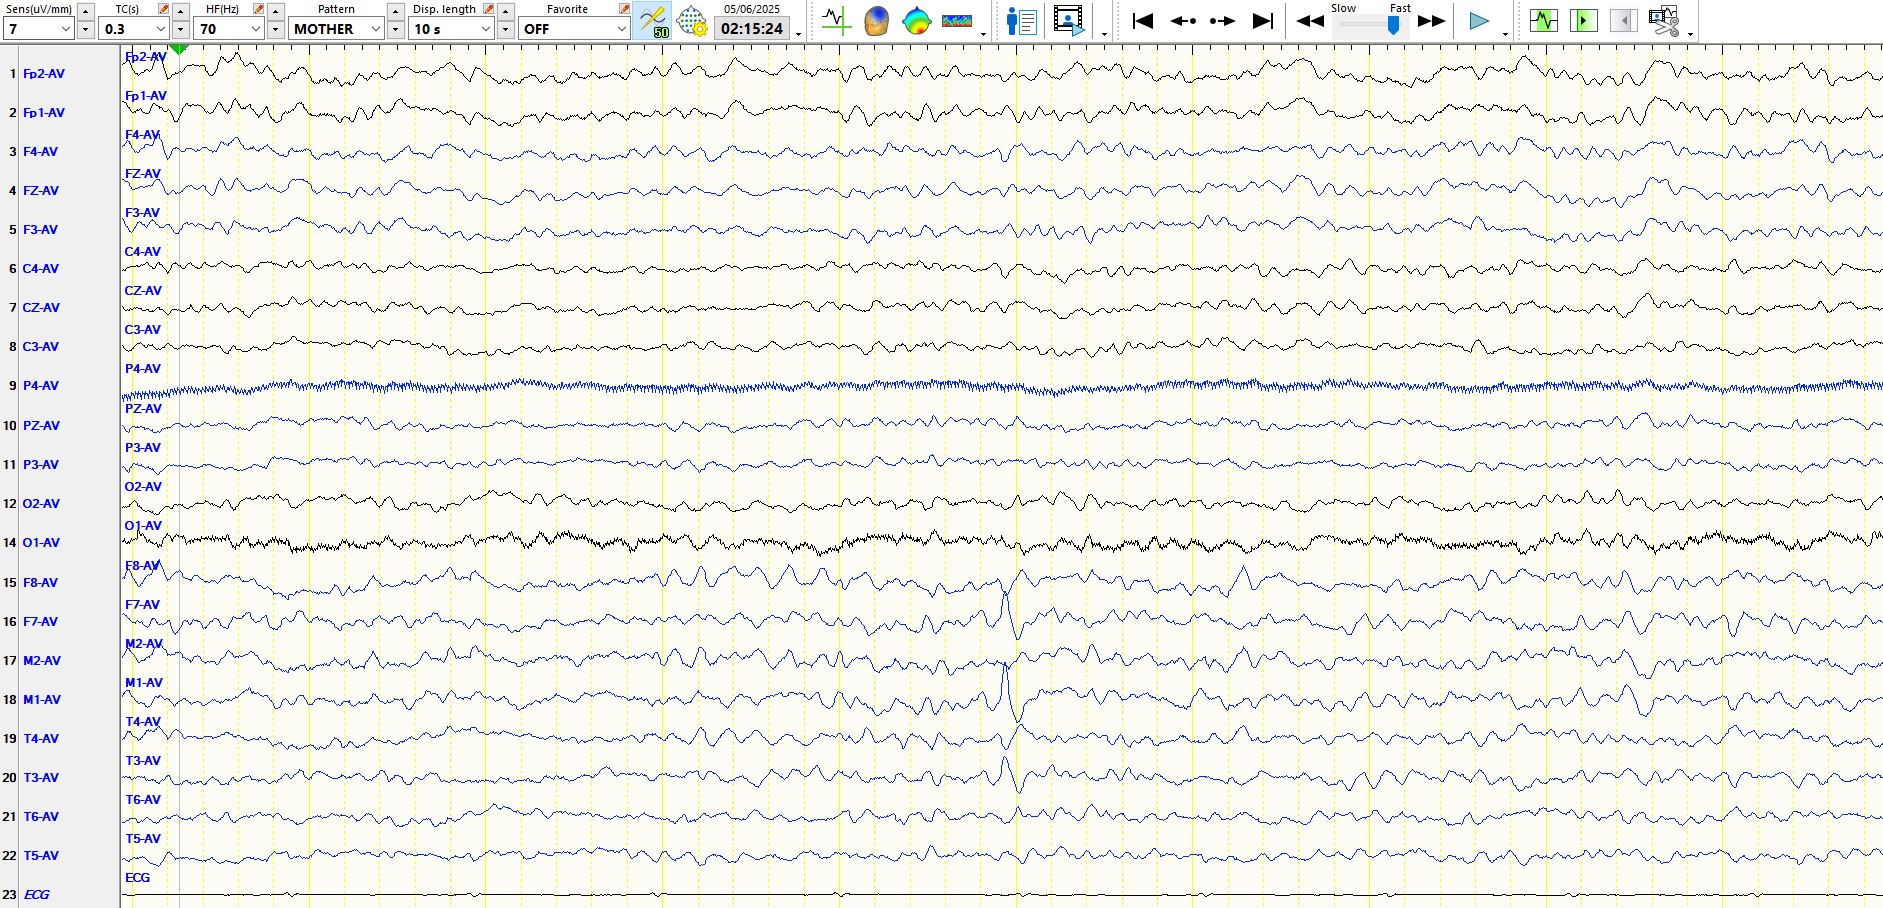
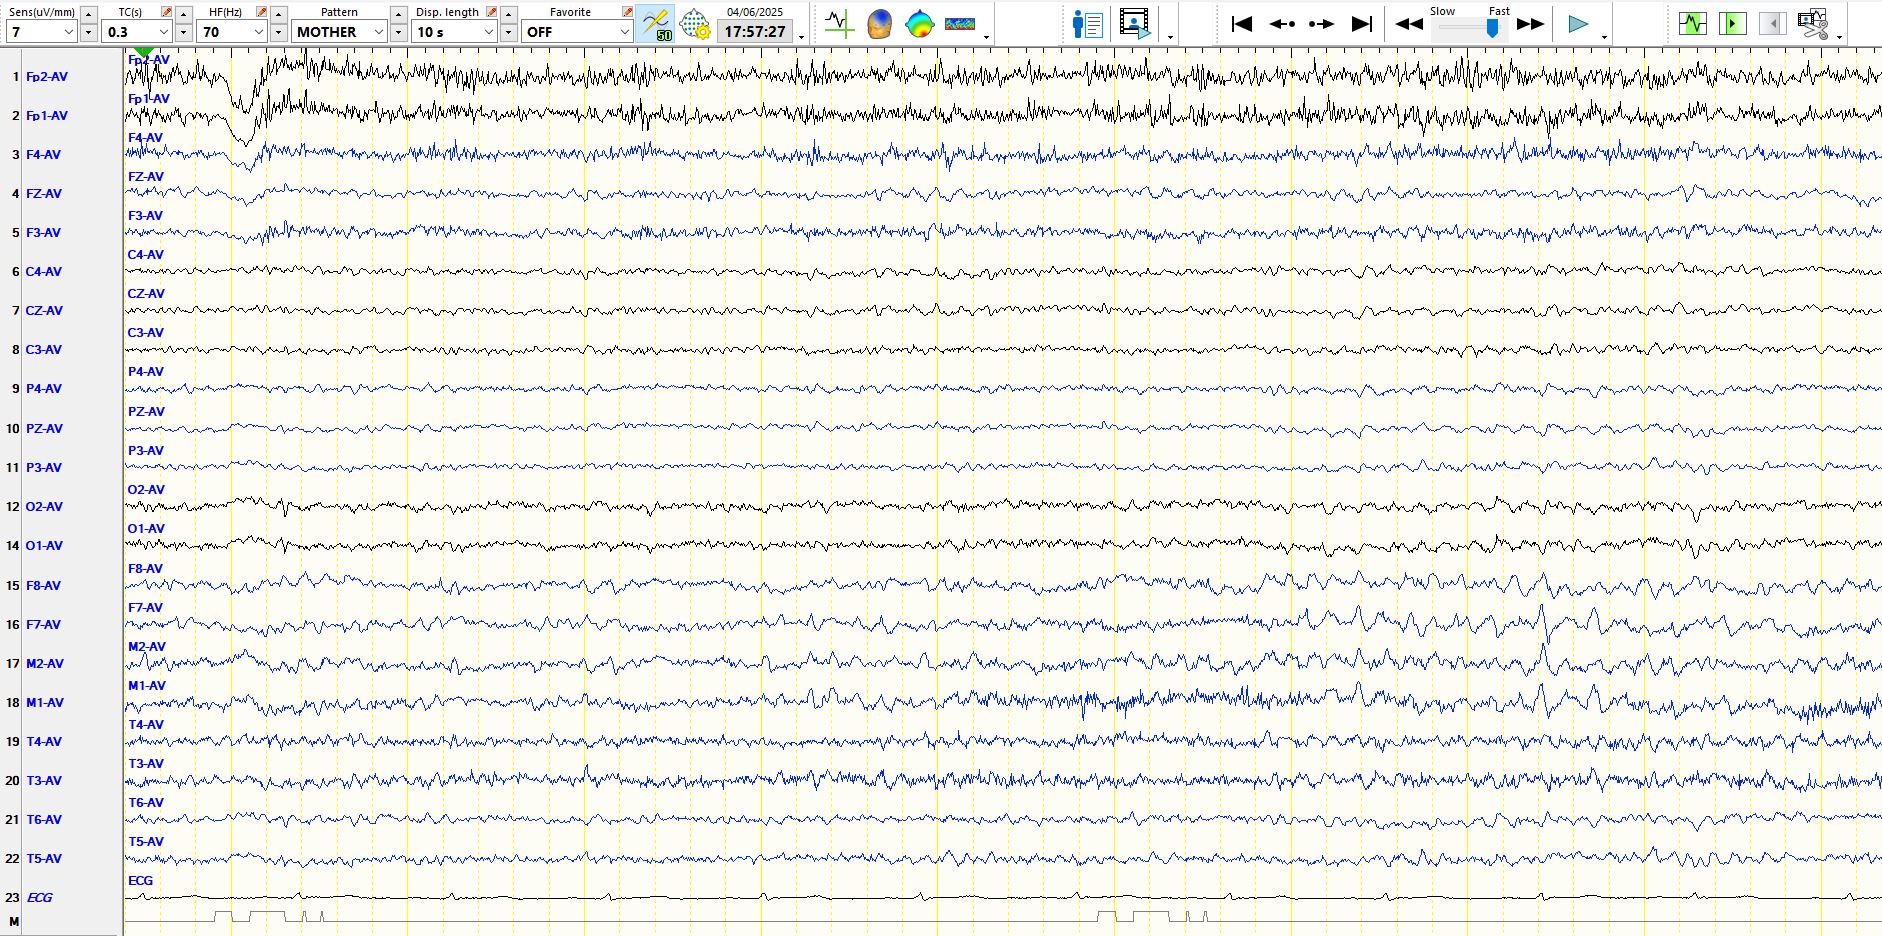
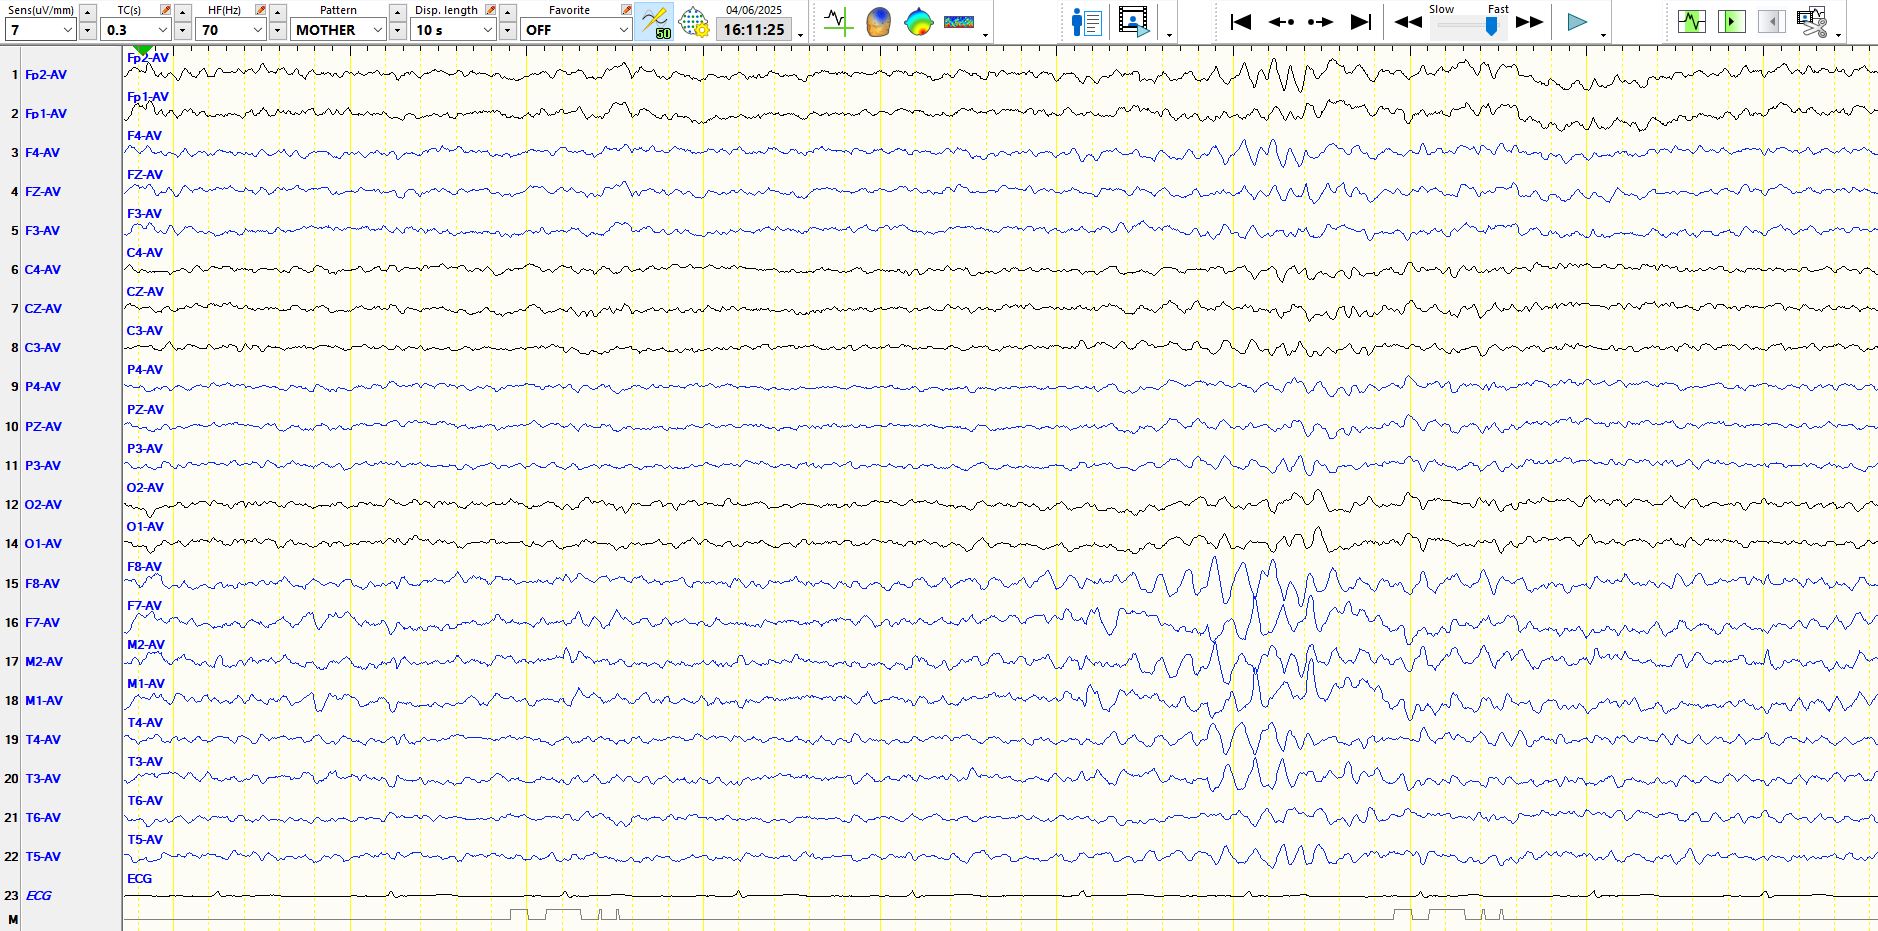
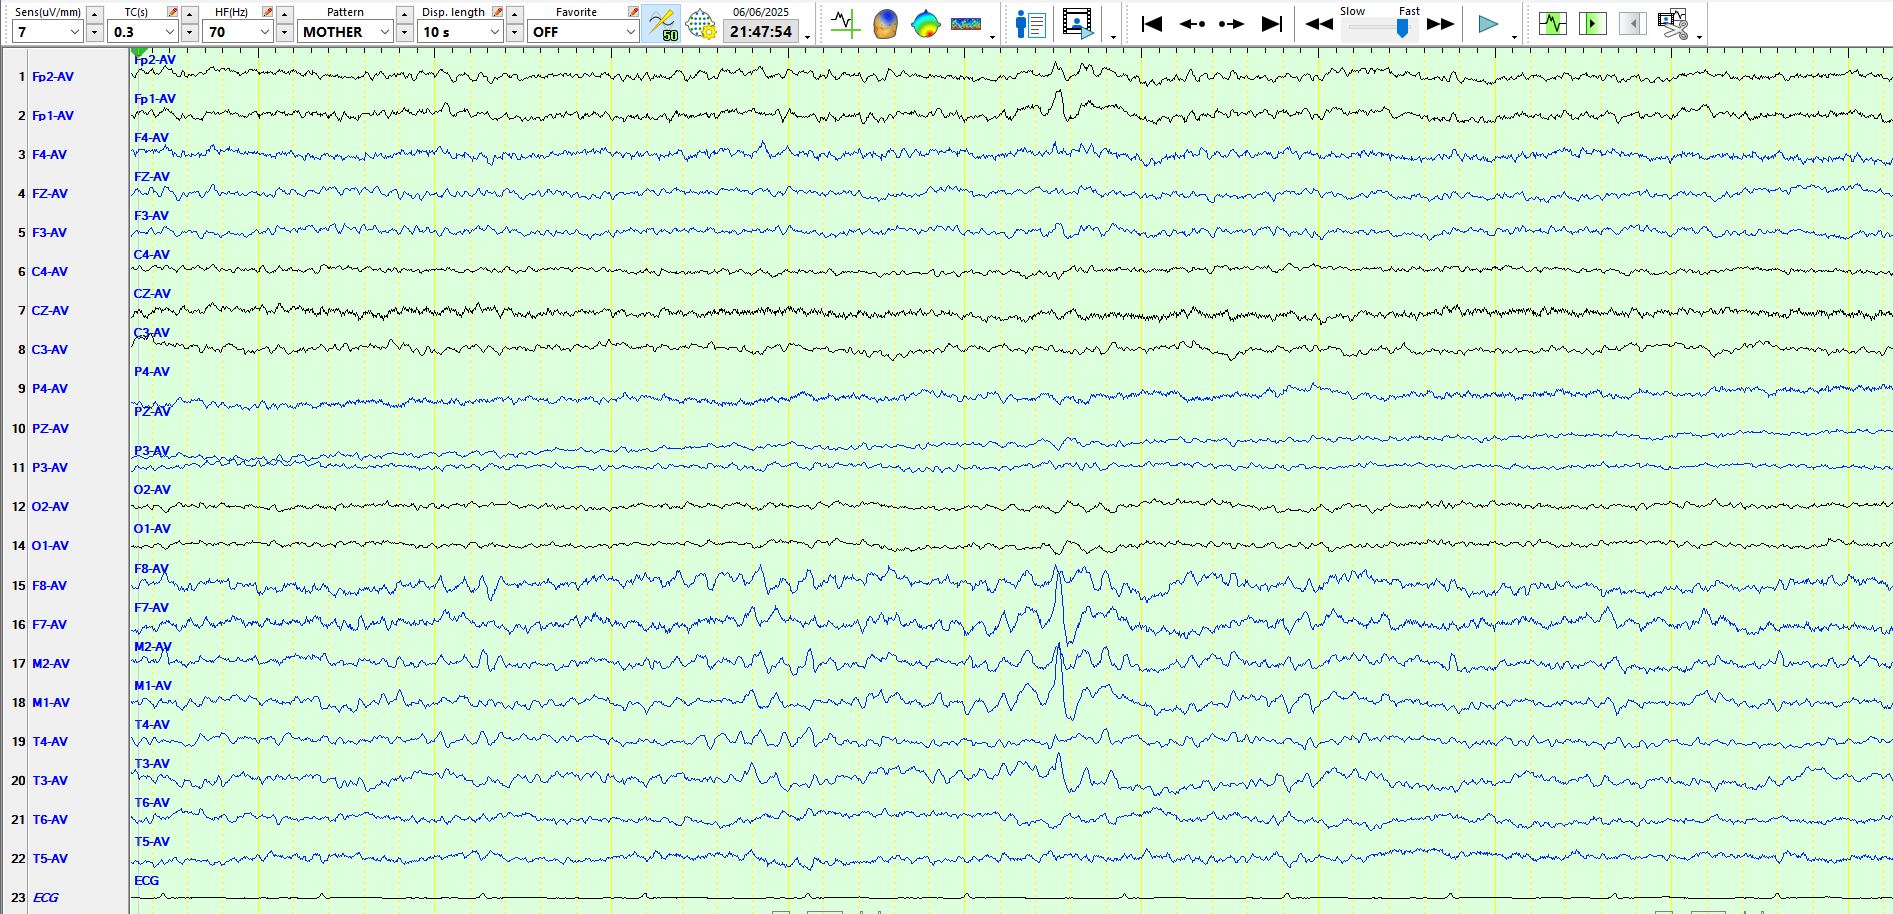
The page above again demonstrates the temporal alpha frequencies. In the middle of the page there is a wave that has a slightly sharp descent, with a different frequency ("base") to the preceding waves, at F7-M1. However, given its low amplitude and resemblance to the morphology of the wave highlighted in figure 2 above, one should simply note this wave in your memory bank or in the report, and avoid calling it a sharp wave or spike
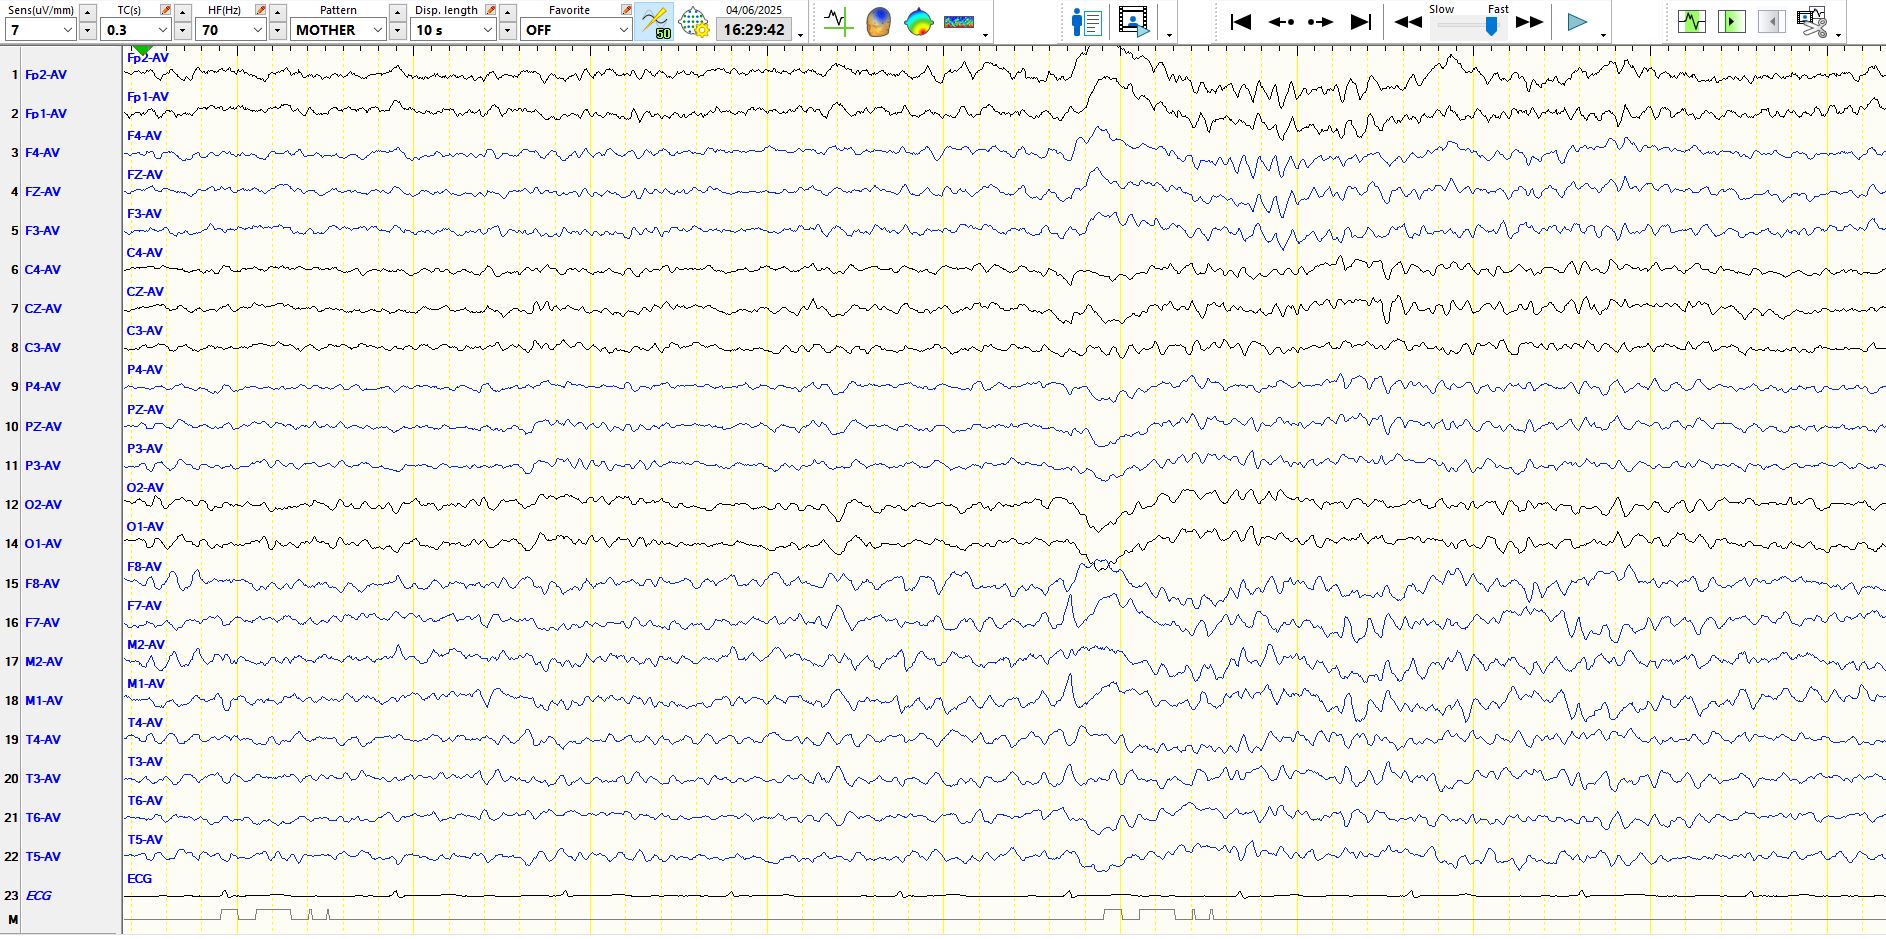
In the sixth second of the page above there is a wave at F8-M2 that resembles the wave at F7-M1 highlighted on the previous page. This wave at F8-M2 above is not dissimilar to the waves at F8-M2 seen in the last second of the same page above.
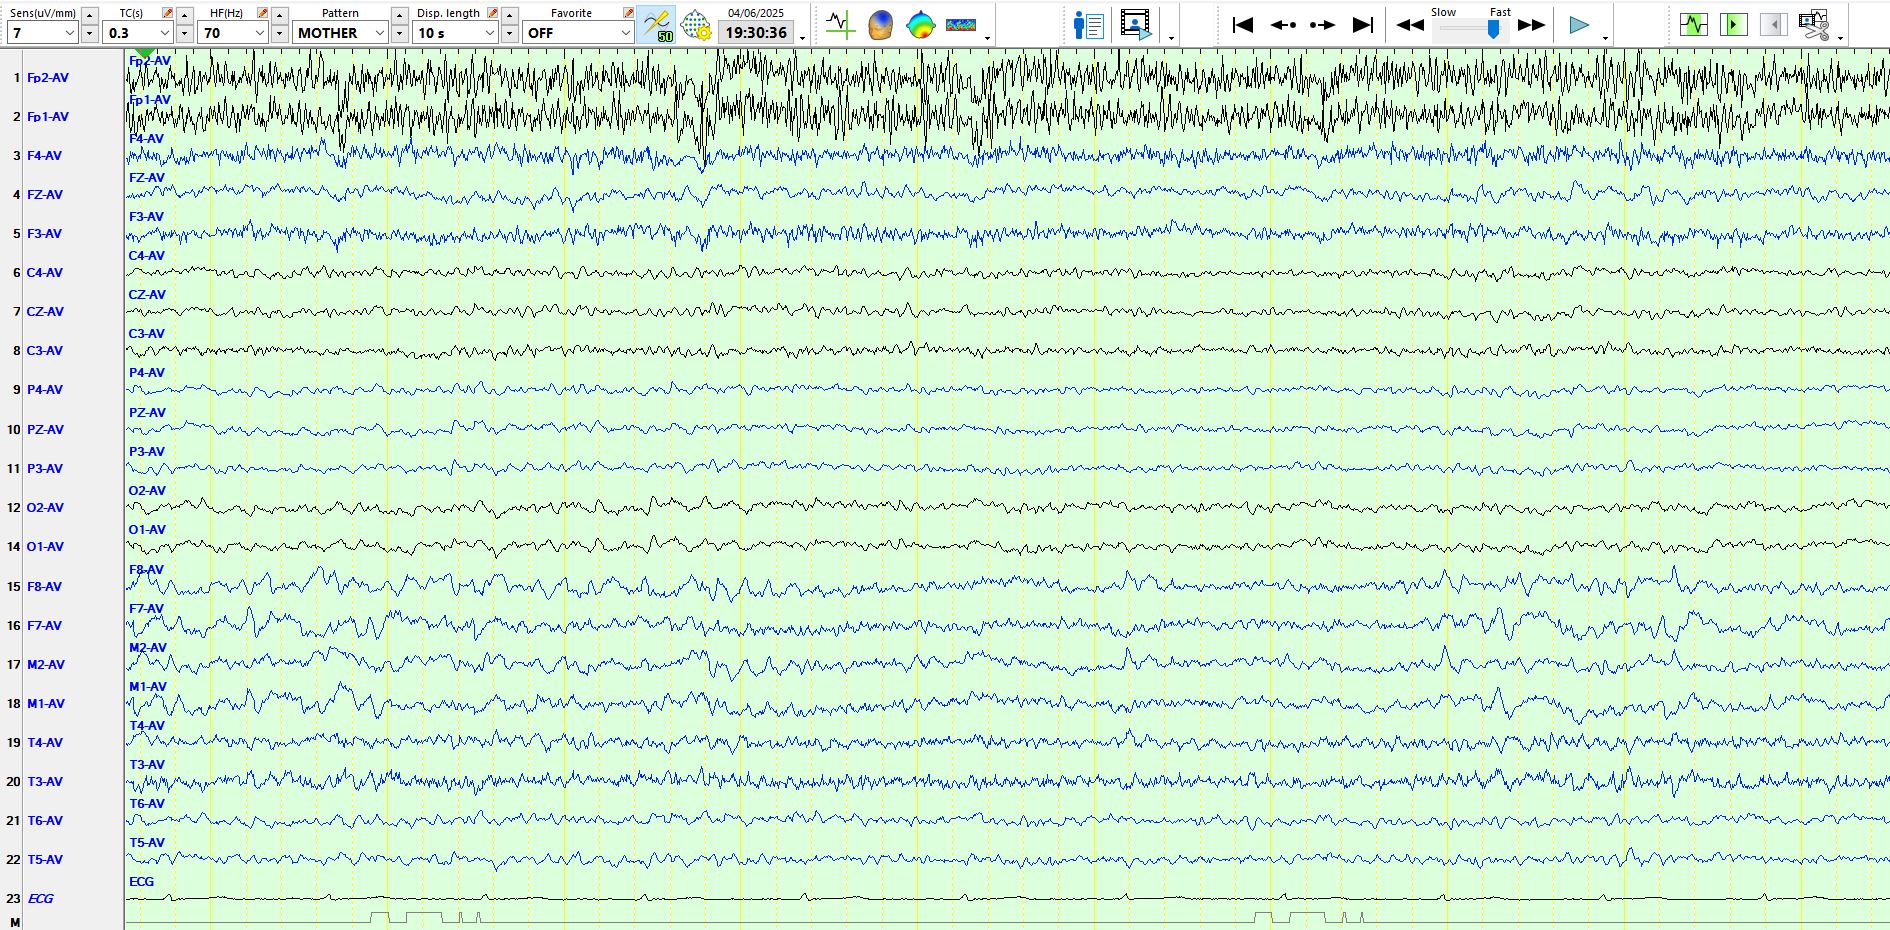
In the page above, the patient is in stage I sleep. In the sixth second there are two sequential, sharply-contoured waves at M1-F7. If you look at T3, you will appreciate that these 2 waves are simply part of the background, progressively ascending in amplitude and then descending again. Hence, these are typical wicket waves, on this occasion appearing as a pair that catch the eye. A key point is that you should be on your guard for wicket waves and wicket spikes in someone who has lots of temporal alpha in the awake state. Wicket waves and wicket spikes, which may appear during the awake state, sometimes become much more obvious and troublesome to the reader during the earlier stages of sleep. These waveforms lead to lots of "false positives" on EEG reports, so much so that you should consider them "wicked waves". This will become more apparent below.
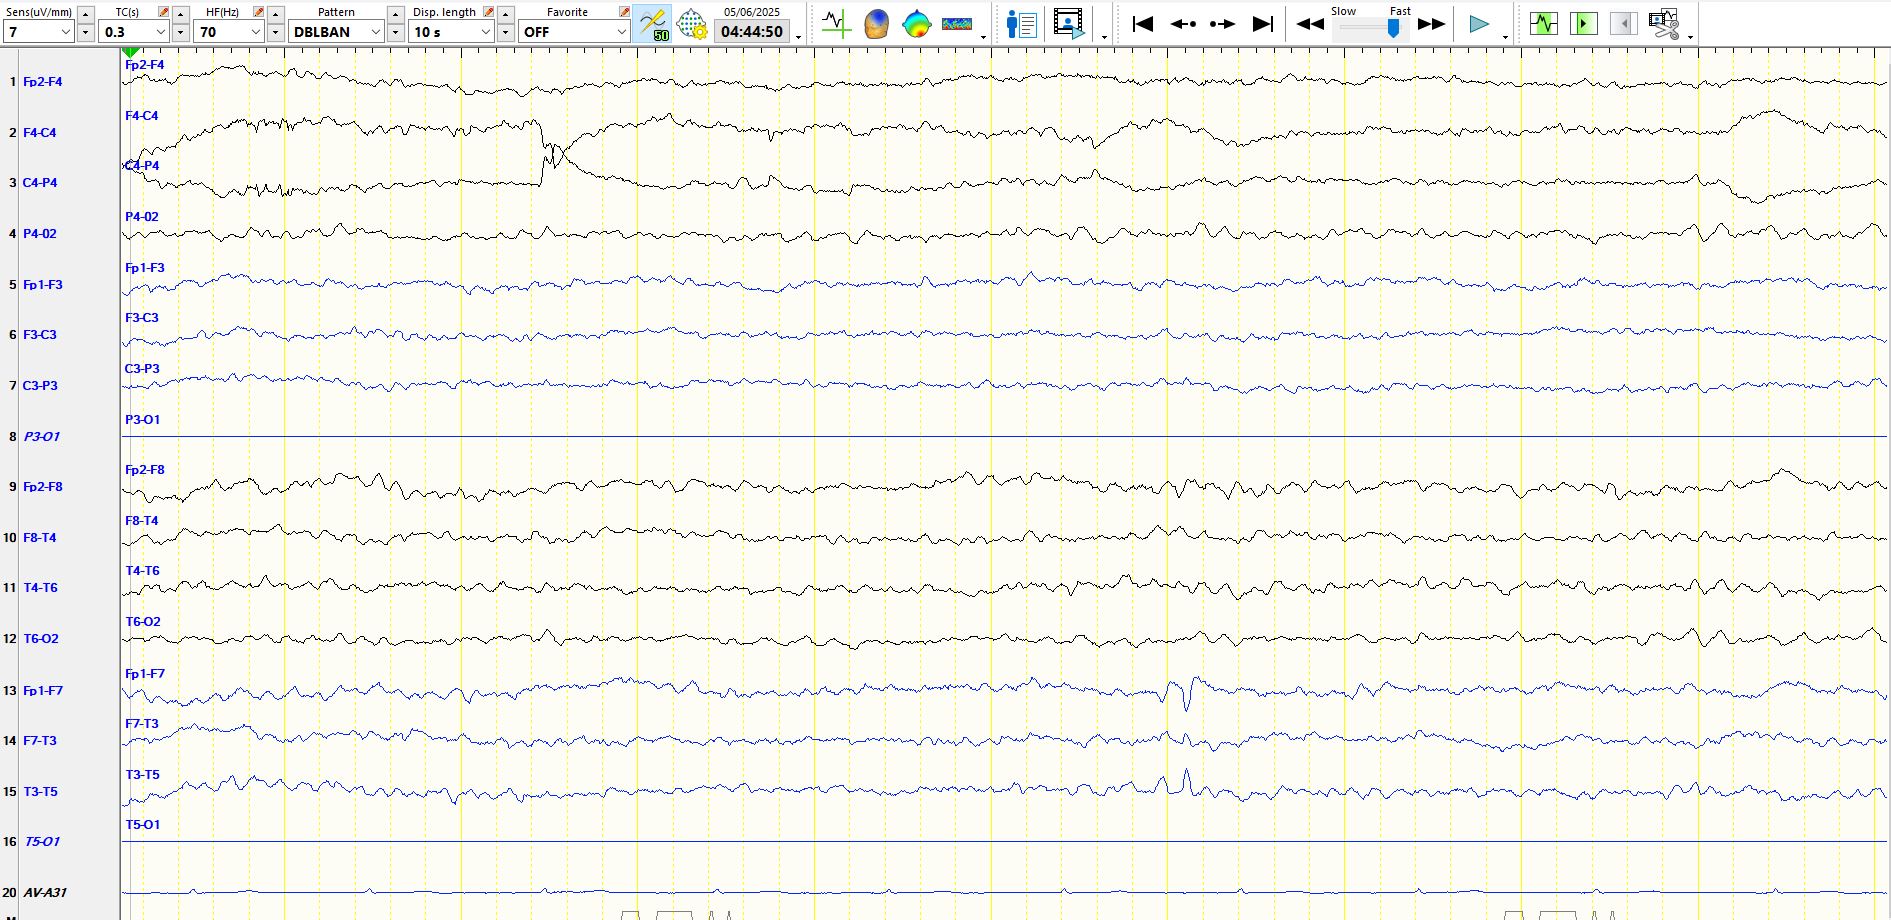
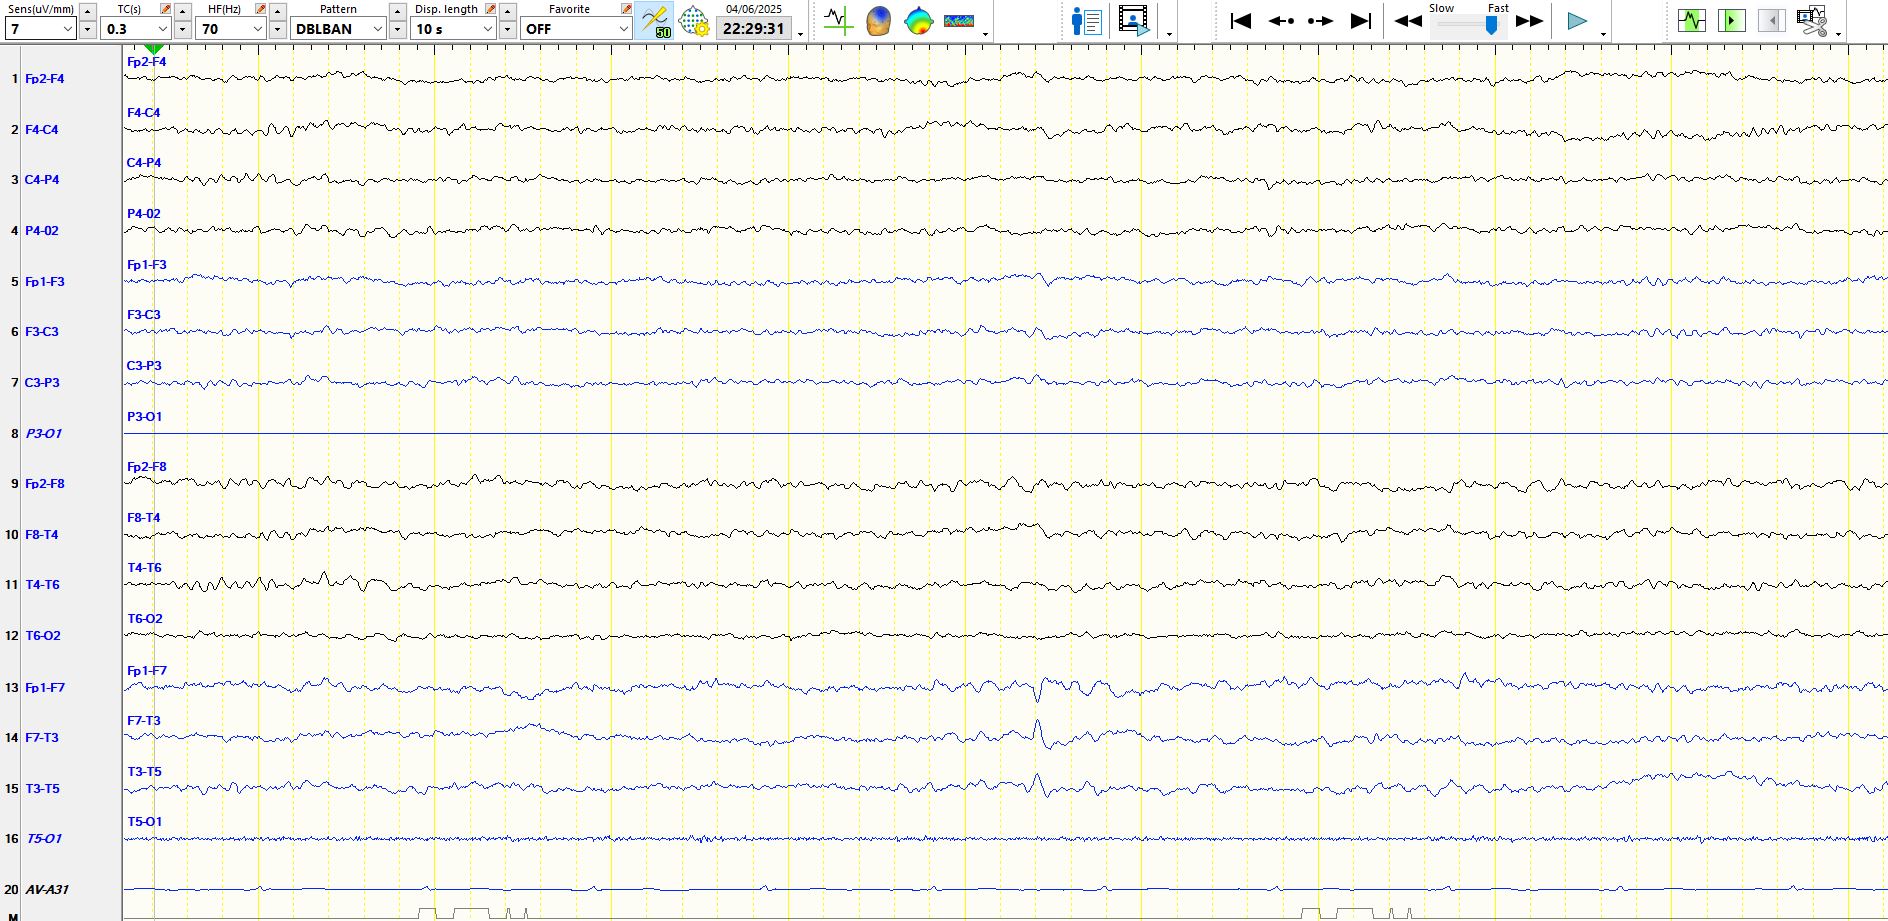
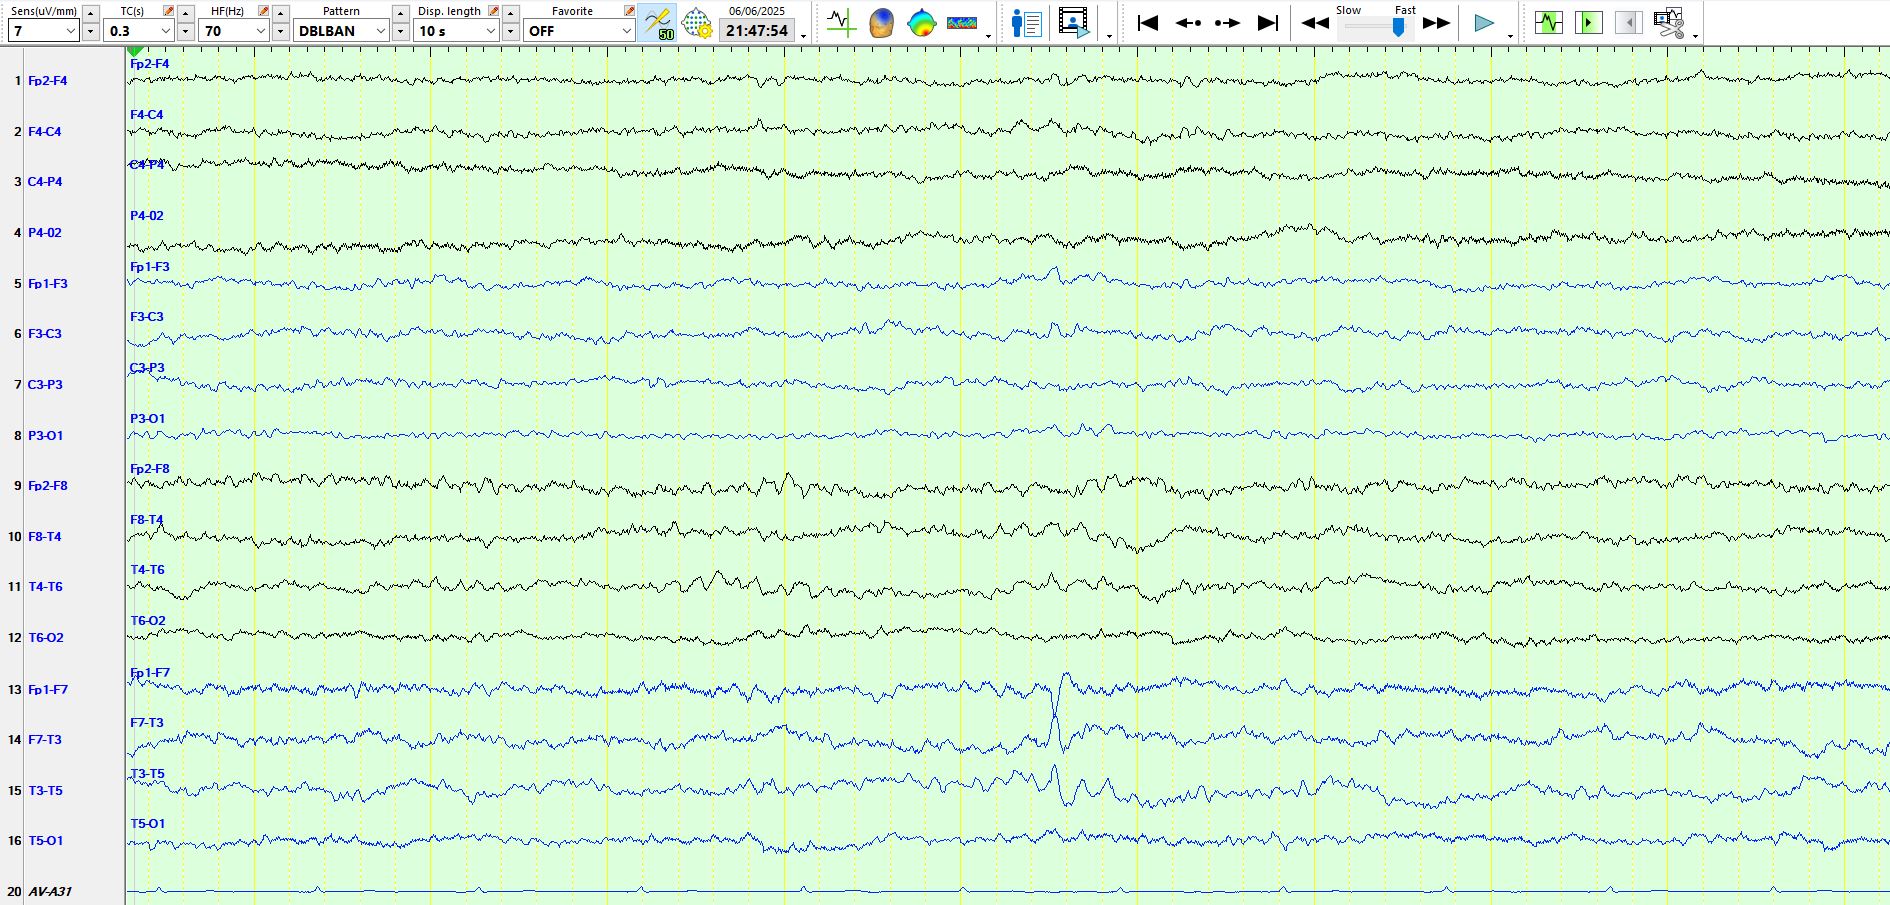
The above page is a representation of the previous page, here in the bipolar montage. You will be forgiven for thinking that the deflection at FP1-F7 is different to the background in channel 13 and that its second component is "steep". When confining your gaze to channel 14, you will readily appreciate that it is part of a rhythm.
At first glance at the above page, you likely will think that this is a barn door spike-and-wave at M1-F7-FP1, as the wave is remarkably high in amplitude, sharply-contoured and is followed by a delta wave. In your haste to read the EEG and report it, stop for a moment and consider the alternative possibility; the sharply-contoured wave appears at lower amplitude in T3, where it is clearly part of the background, which is progressively ascending in amplitude, as it is in F7 and M1. This is a "wicked spike"!!! Apologies for the terminology, but it is a good way of remembering it. The delta wave is abnormal, but this certainly is not a spike-and-wave. A key point here is that amplitude and the morphology of "spike-and-wave" is not enough to get you over the line and for you to call this an inter-ictal epileptiform discharge. Remember, if you fall into this trap, you run the significant risk of a false positive, of the reader concluding that the patient has epilepsy and of unnecessarily condemning someone to a lifetime of antiseizure medication based on these waves on the EEG, when they don't have epilepsy. Hence, set the bar high and never think that anyone will judge you poorly if you disregard something that may be a spike or even a "spike-and-wave". It really is a terrible thing to try and explain to someone that EEG performed years or even decades before has been misinterpreted and has resulted in the incorrect use of antiseizure medications. I see this all too often. Hence, don't worry about missing stuff (these are false negatives) but instead lose loss of sleep over false positives, and remember the page above. See Red alert
Here is another example of sequential wicket waves at M1-F7-T3 (above). You should not be deterred by the fact that this patient generates wicket waves much more frequently over the left temporal region than the right. There is a subtle delta wave after these wicket waves on the left only, but this does not change judgement about the nature of these two waves seen above.
The page above is another good example of a wicket wave at M1-F7-T3. Have a look at T3 and you will realise that it is part of the background and does not interrupt the background.
If one looks at the ascending slope of the sharpest wave above, it appears slightly more rapid than the descending component of the wave, resembling some of the waves at the top of this discussion. This is followed by a subtle slower wave at M1. The same rules apply as before. This sharply-contoured wave is part of a sequence of waves.
And here is another example of a sequence of waves followed by a delta wave.
In the last two seconds above there are delta waves, preceded by wicket waves. Ditto in the first 2 seconds

Just after the EMG artifact above there is a delta wave, preceded by wicket waves.
The above illustrates the abundant temporal alpha.
Wicket waves in the temporal regions followed by a K complex, creating an illusion of spike-and-wave.
A midget wicket wave at about three seconds.

The preponderance of left temporal wicket waves is clear and here is another example of such waves, followed by a delta wave at F7-M1 at about five seconds. The delta wave is abnormal, the wicket waves not.
You will appreciate that the 2 waves with the highest amplitude in the page above are part of frequencies that ascend in amplitude. Notice also similar wicket waves at F8-M2 just before the end of the page. Finally, notice that the wave of highest amplitude above has the same shape (morphology) as the wave in figure 2 above (near the top of the page) and some other pages.

Lady luck will sometimes smile cruelly upon you; ECG may be followed by a slow wave (at about six seconds)
Because of this theta wave (at 6s) is triphasic in shape, it is not a typical wicket wave and therefore it likely is abnormal, even in someone who is asleep. Nevertheless, on its own, this is non-epileptiform dysfunction over the left inferior, anterior temporal region (M1-F7-T3). It is not ECG.
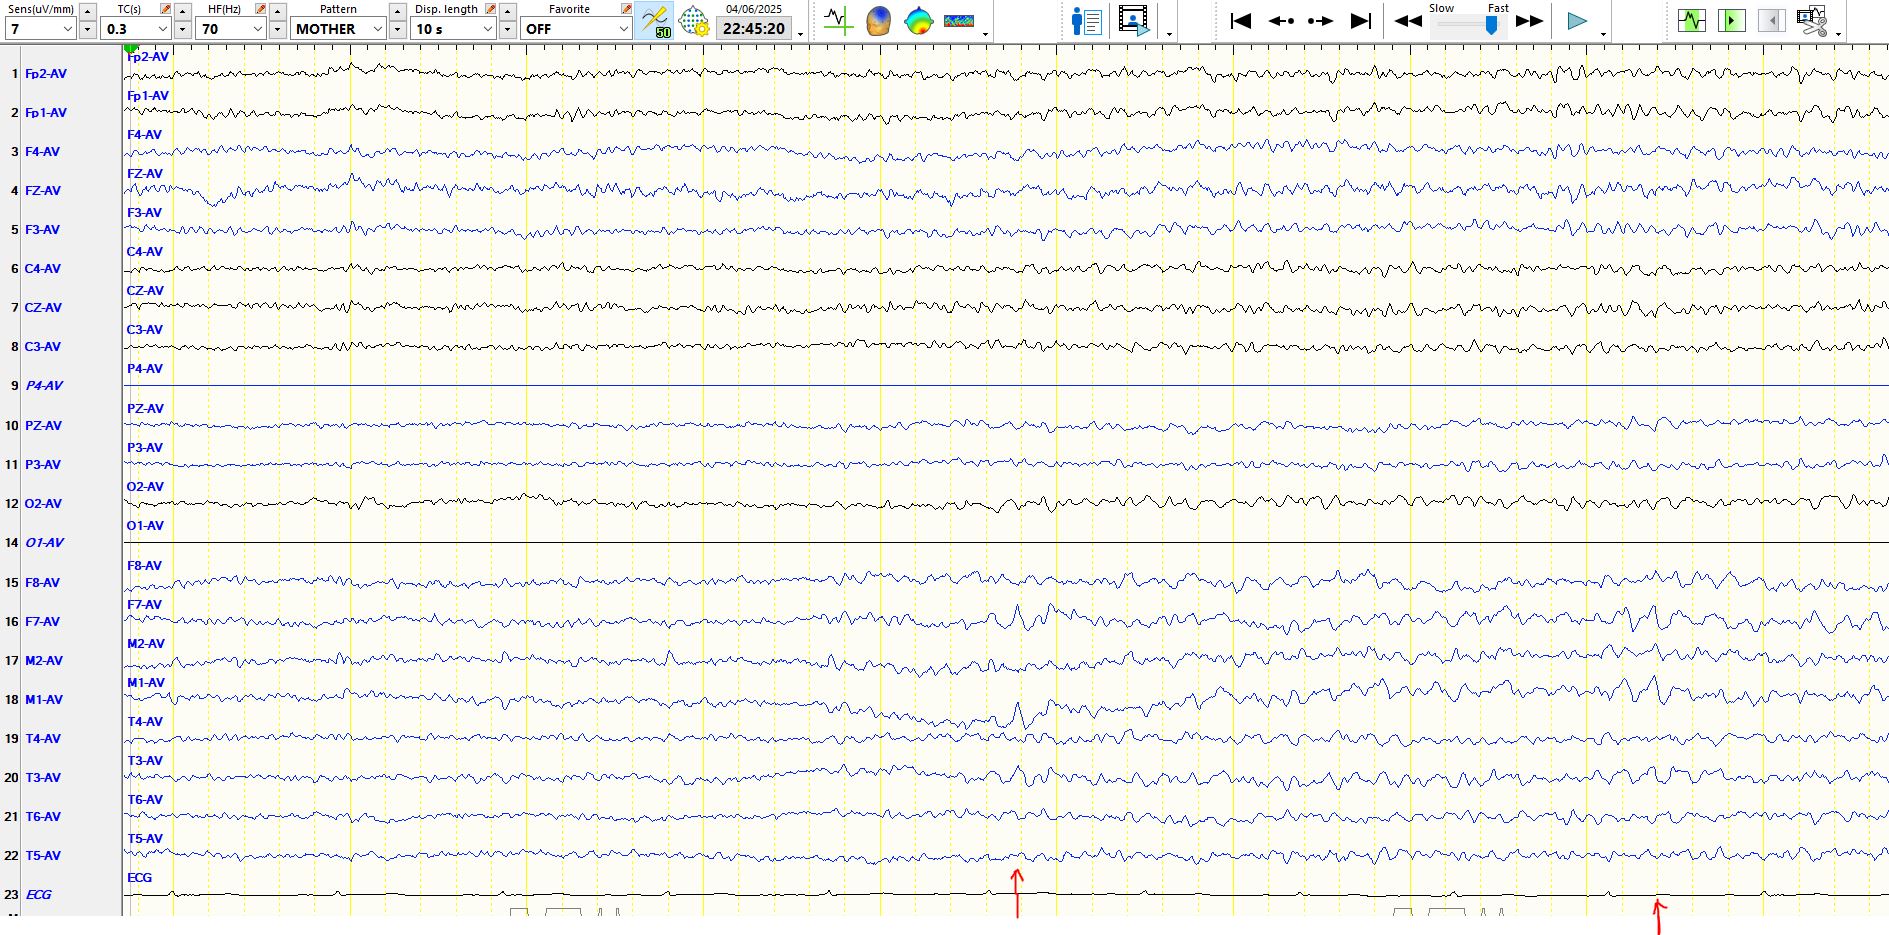
In the page above, the first arrowed wave is no different in morphology to the waves arrowed at the end of the page. The first one catches your eye because of the appearance of a delta wave, low in amplitude, at M1-F7. But this is not sharp and slow wave. It is a wicket wave and a delta wave.
In the page above there are a sequence of alpha frequencies at M1-F7-T3 which you by now will recognise as wicket waves. Notice the morphology of the wave maximal in amplitude at F7 (at about 6-7 seconds), resembling some of the waves seen above, including in figure 2; It has a sharper descent than ascent. On this occasion there is another low amplitude delta wave F7-M1, preceded by wicket waves. You will appreciate why these may sometimes be over-called as sharp and slow wave.
The bilateral but still left predominant wicket waves are clear. About two seconds from the end there is one wave that again has a slightly sharper descent than ascent but is clearly part of the background. It provides you with the reassurance that isolated waves with this shape are indeed isolated wicket waves when they occur on their own or even when they are followed by a delta wave.
The page above just makes the point that these waves ascend in amplitude and in this patient remain best developed on the left. Don't worry about the asymmetry. Faces are asymmetric
There is an isolated wicket wave above, no disruption of the background, no delta wave and no different from some of the waves seen above on previous pages
The above is a bipolar representation of the previous page. Notice the progressive ascent of waves preceding the most obvious discharge that catches your eye
You will again notice that, in the page above at about seven seconds, there is a wave at F7-M1 whose descent is much sharper than the preceding waves. This wave is useful as it provides you with a visual benchmark for the variable appearance of wicket waves in this patient. It also allows you to judge waves of this nature that appear in isolation or are followed by a delta wave as representing nothing more than isolated wicket waves. Your right hippocampus is needed!
This is an example of an isolated wicket wave, again part of a sequence of waves during sleep

Another isolated wicket wave at about four seconds
Bilateral temporal alpha (wicket waves). You will notice delta waves at F7-M1 during the third, seventh and last two seconds of the page at F7-M1. Notice that the penultimate one is preceded by a sharply-contoured, high amplitude wave that is part of the ascending background. This reinforces some of the points made above.
This wave is part of a sequence of waves and therefore represents a wicket wave, here seen on the bipolar montage
In the third second, there is a delta wave preceded by a sharply-contoured wave, which is part of the background and has a shape identical to waveforms pointed out earlier and to the wave appearing approximately two seconds later, which is also part of a sequence of waves.
Another example of a "wicked wave"
Predominantly left-sided wicket waves; notice the shape of the wave just to the right of the middle of the page at F7-M1-T3
And...bilateral temporal wicket waves, followed by a delta wave F7-M1
Here is another "wicked wave"; same page represented on 3 montages
Bipolar AP:
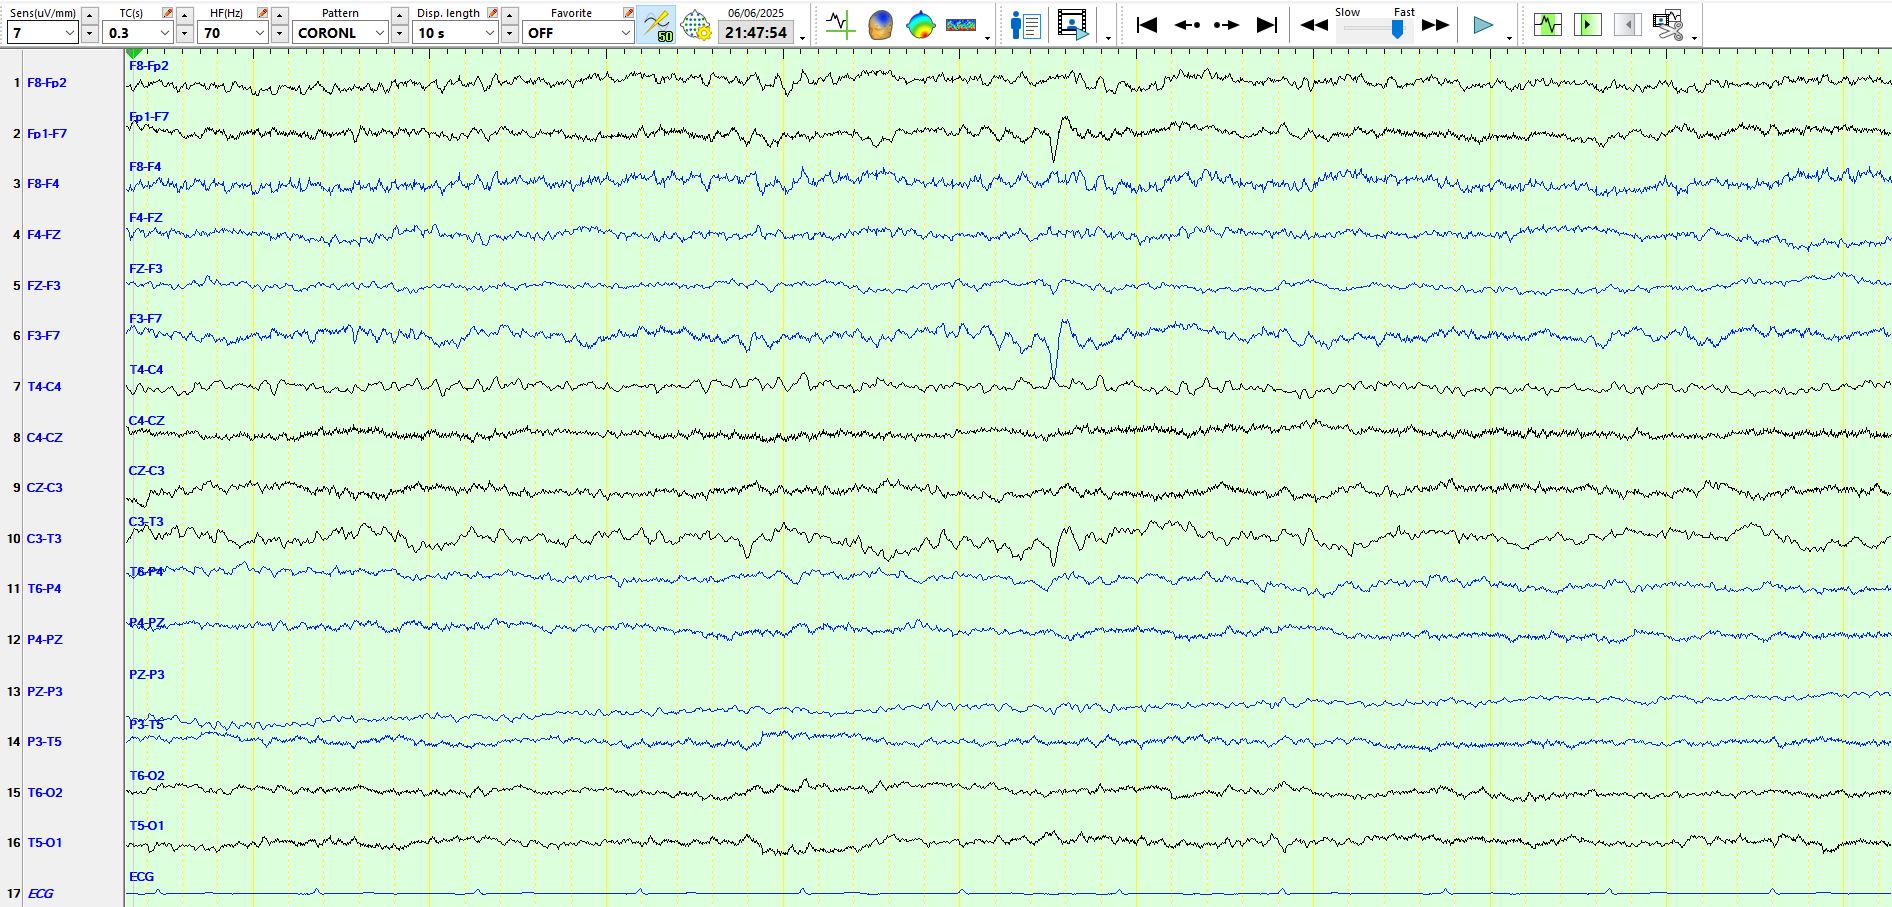
Coronal:
Here are a couple of references:
wicket-spikes-clinical-correlates-of-a-previously-undescribed-eeg-pattern.pdf