31y, drug resistant epilepsy
May 15, 2025What is the nature of this sharply contoured waveform in the middle of the page? The patient is in stage II sleep (No eyeblinks, no EMG, presence of spindles and an electropositive vertex wave approximately 3 seconds from the end of the page)
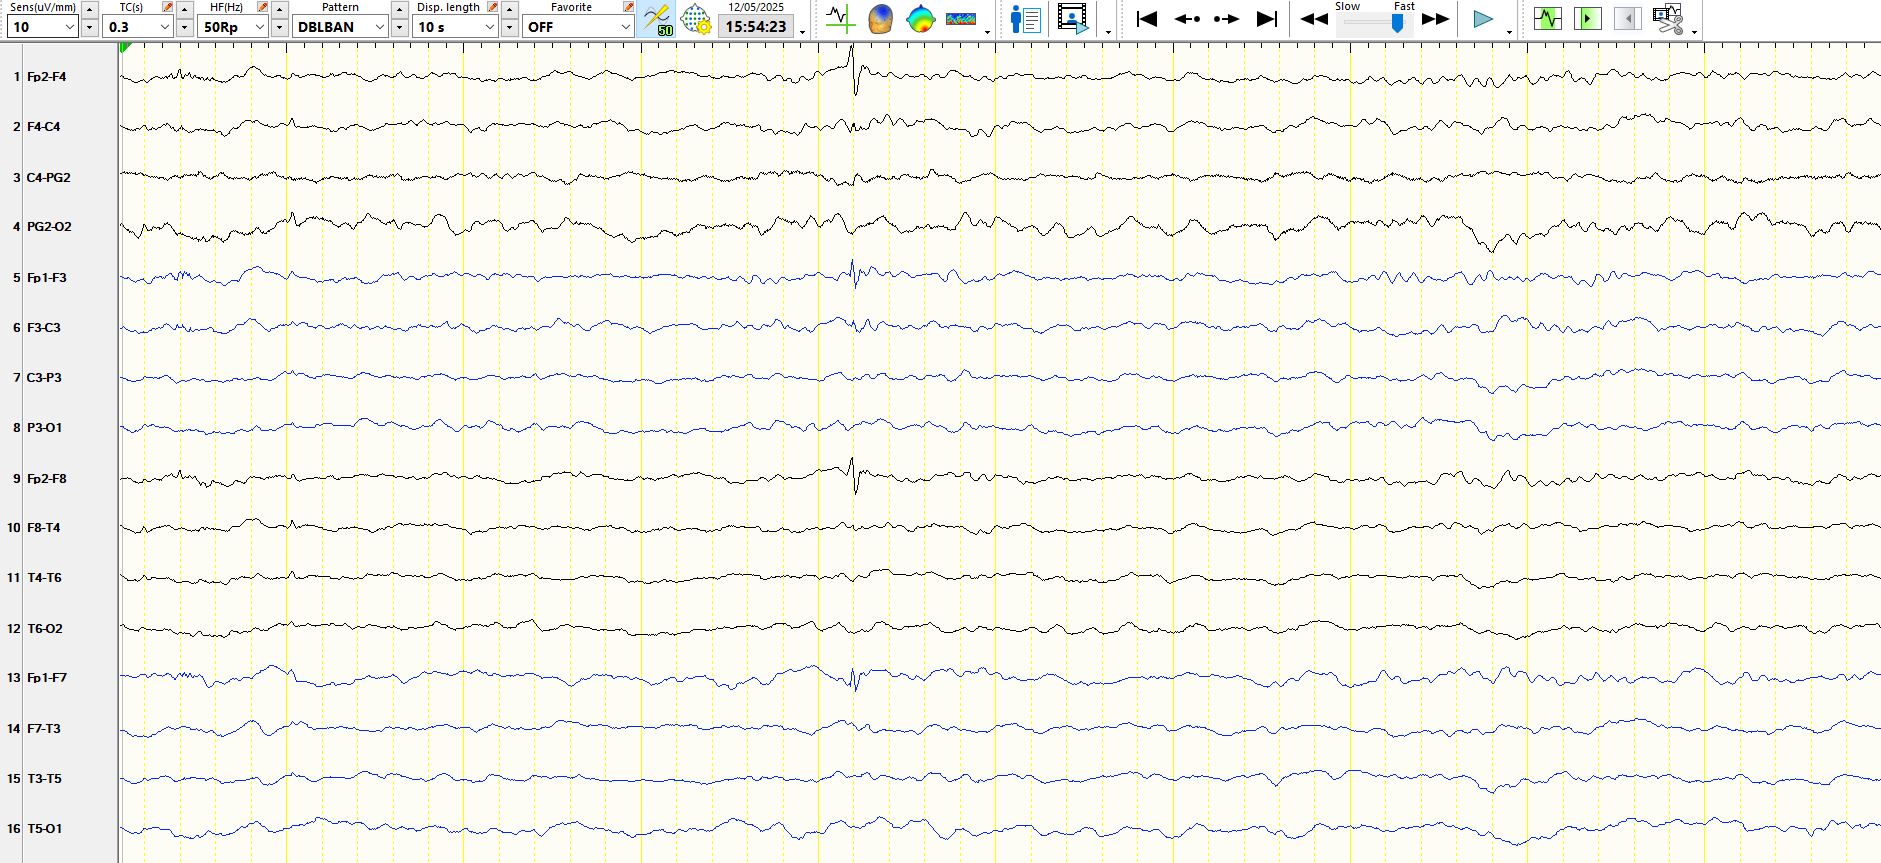
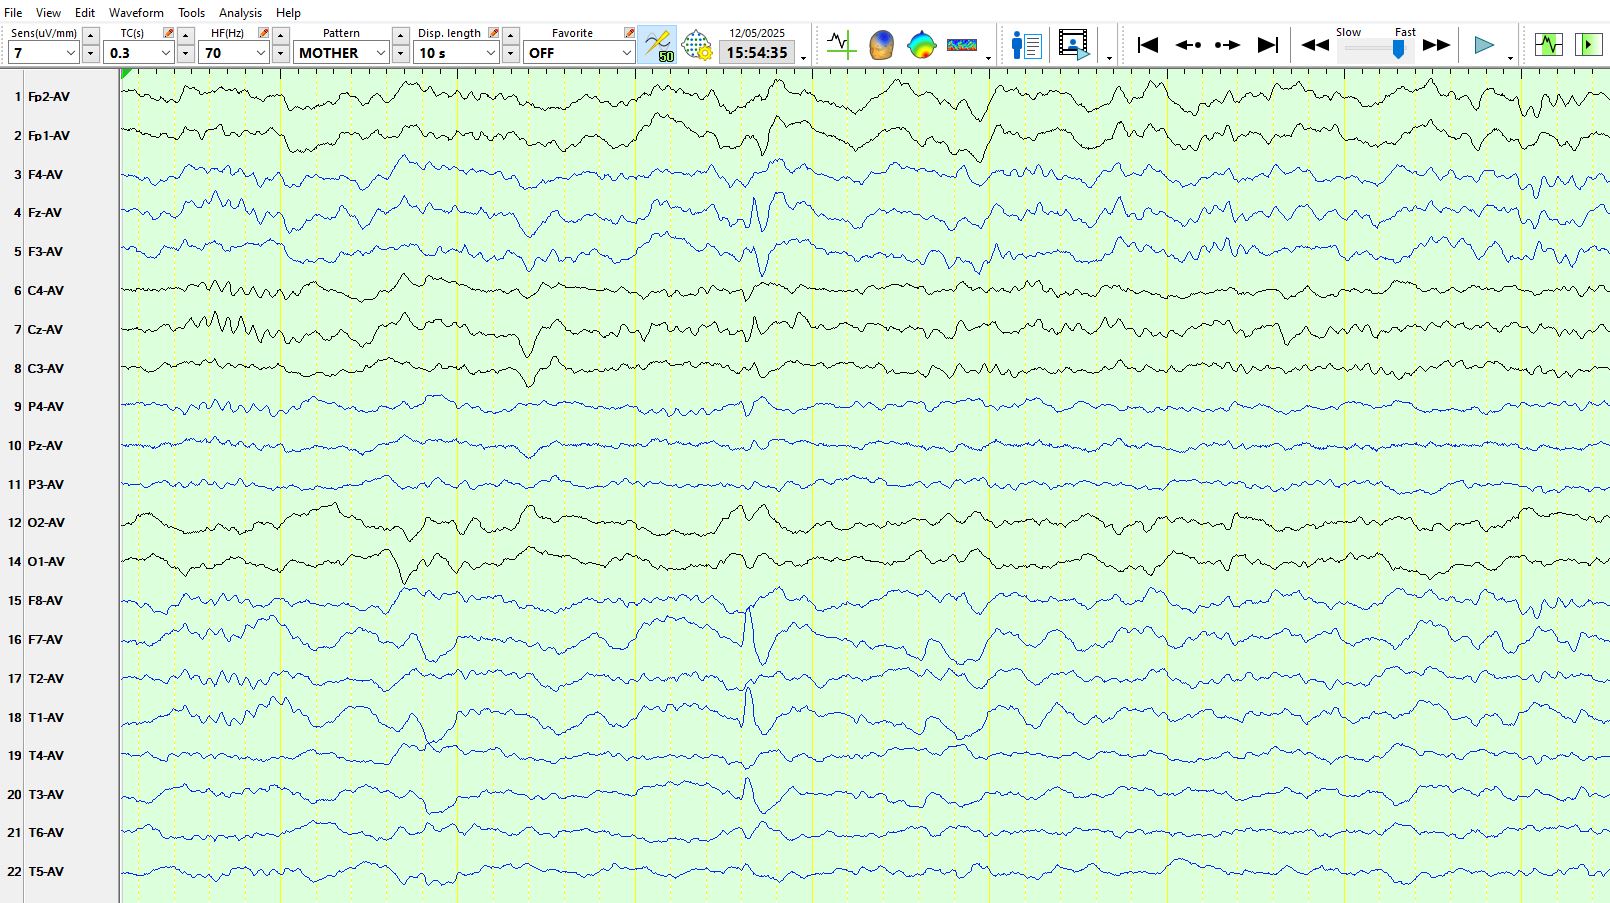
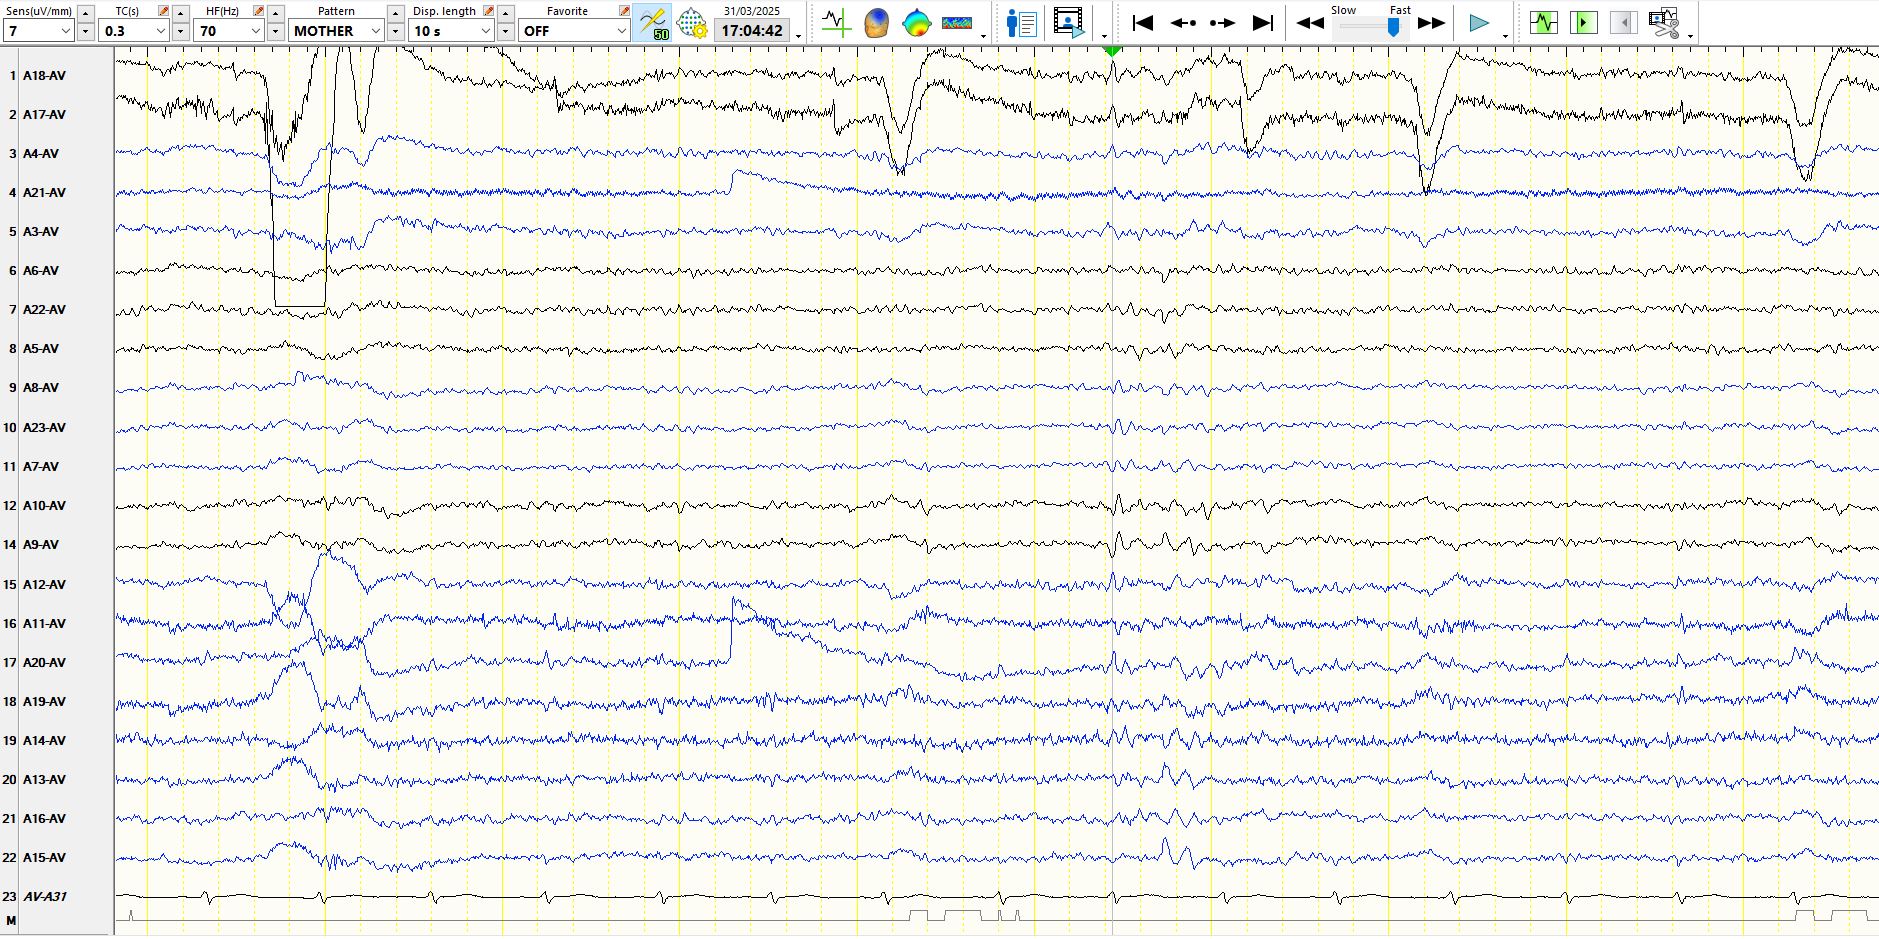
Notice that the notch filter is on for the page above. This is what it looks like with same filter turned off:
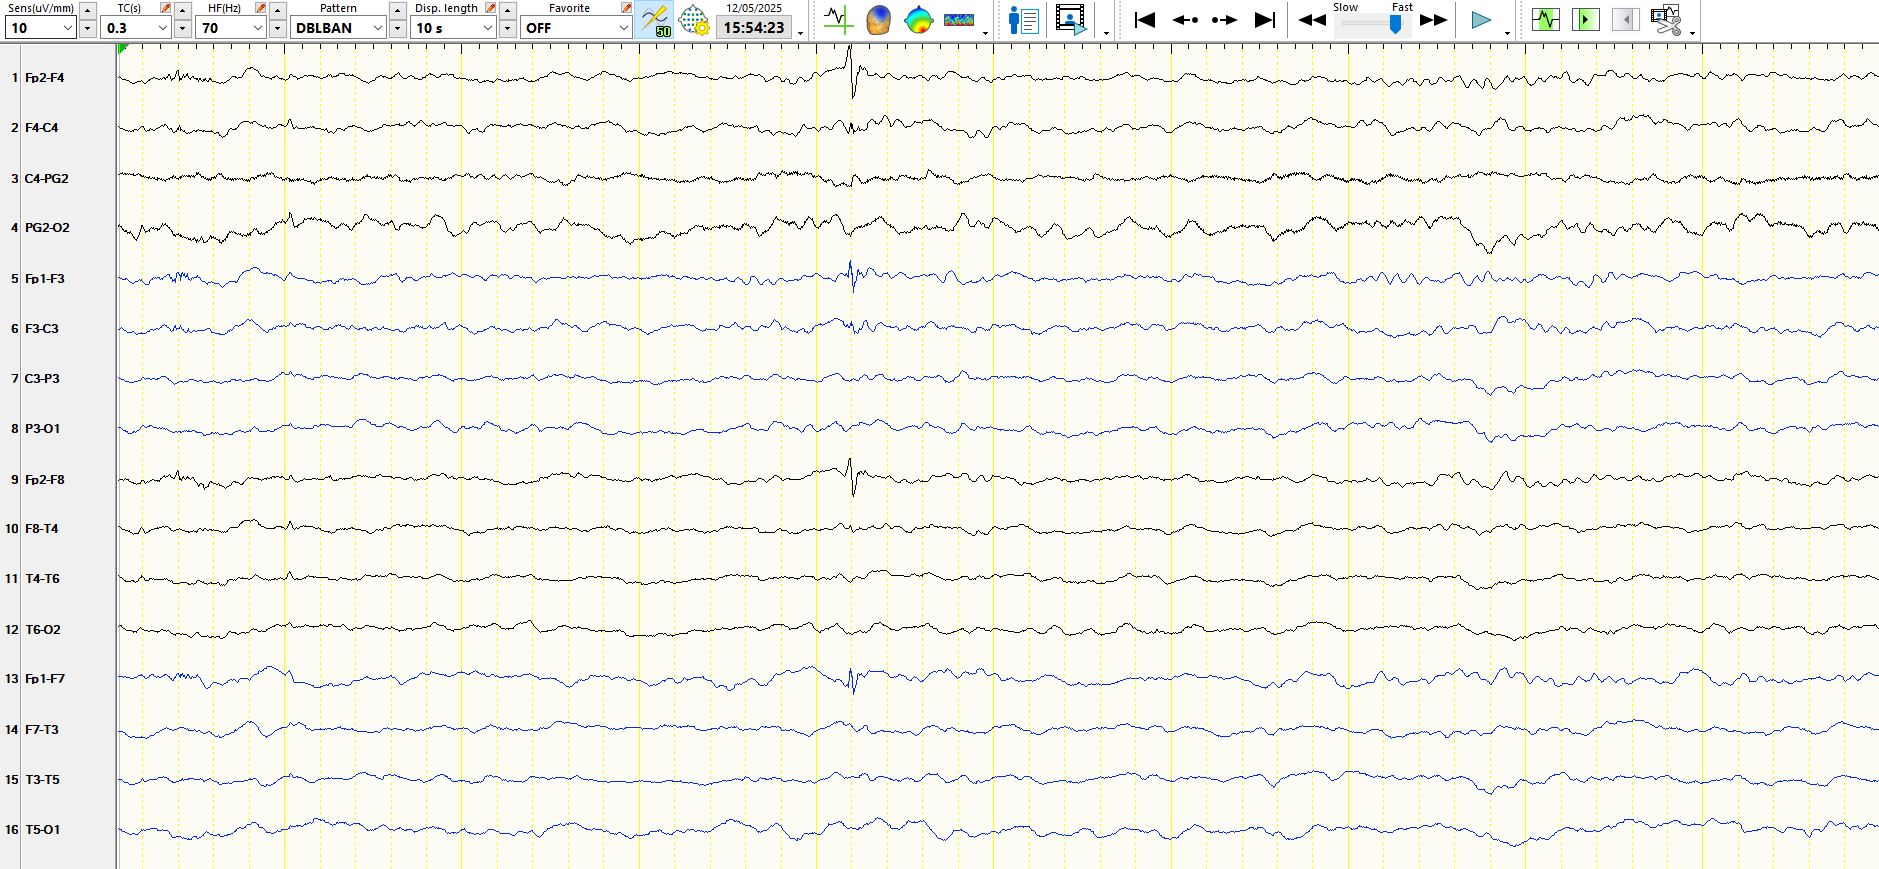
Notice the "pixelation" / multiphase component off the waveform when the notch filter is turned off in the image above. This simple example of turning on the notch filter illustrates the danger of turning on filters, with the result that artefacts are converted into "spikes", which in turn may lead one down the rabbit hole of an incorrect diagnosis of epilepsy, which, once made, may stick for decades. There are theta and delta waves at F7-T3-T5, most conspicuous in the first 2nd of the recording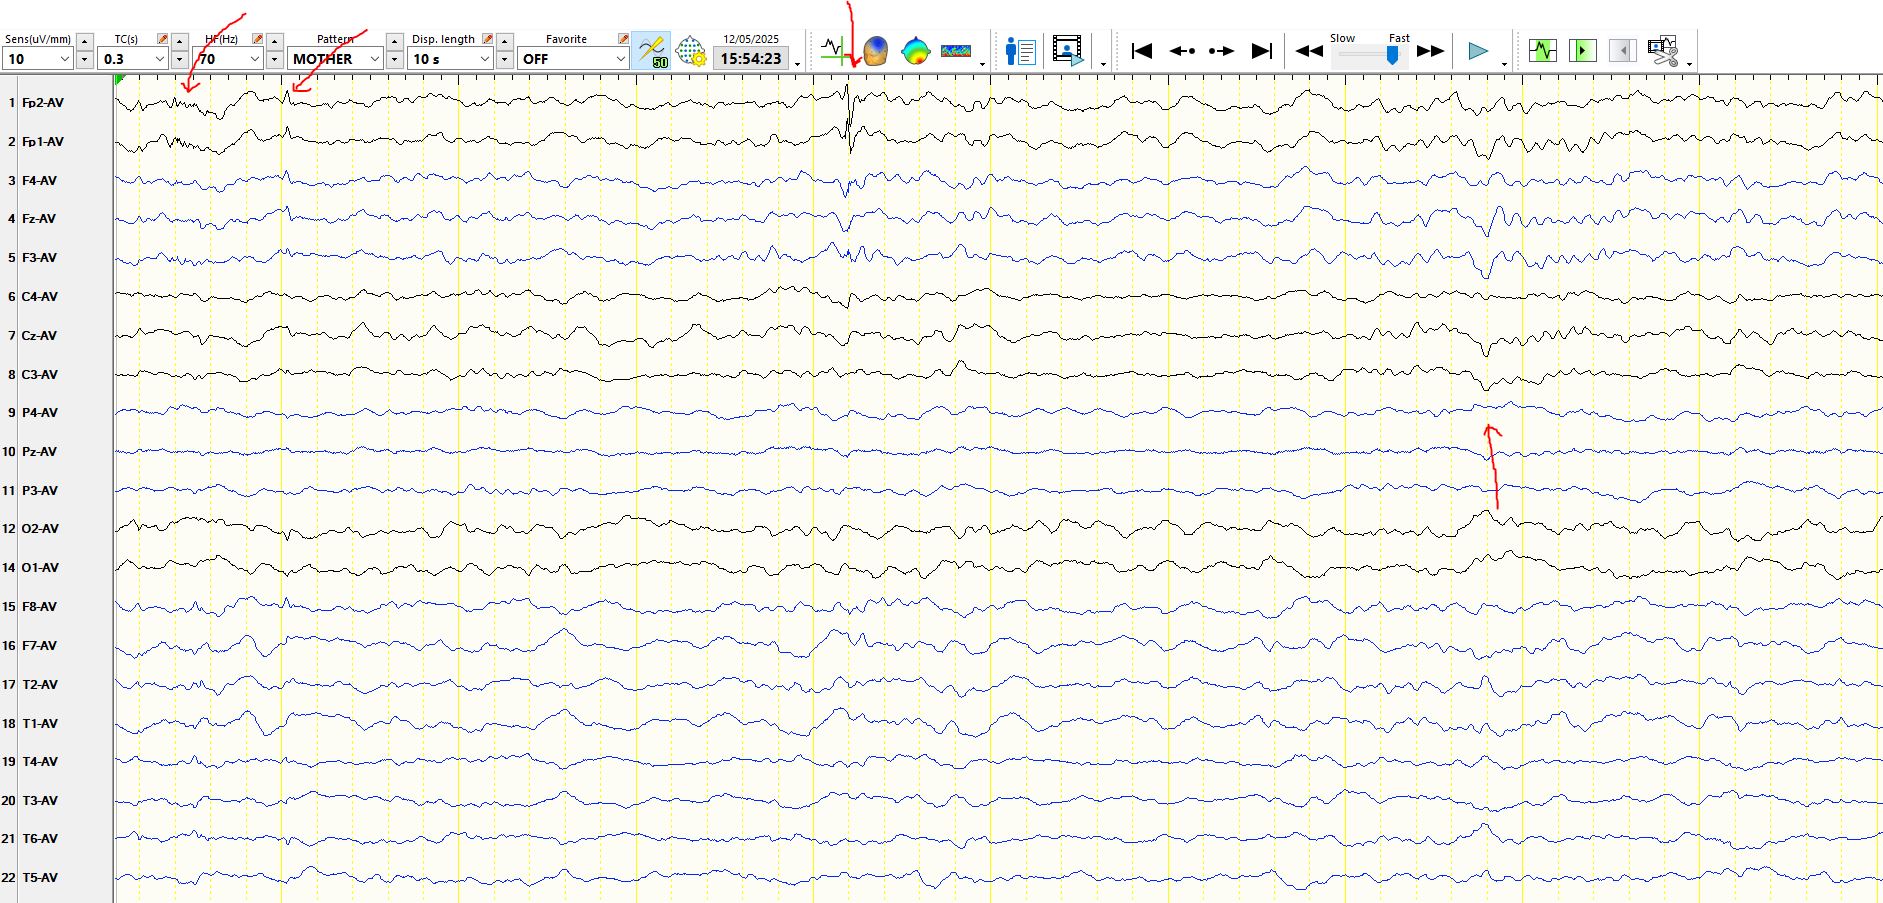
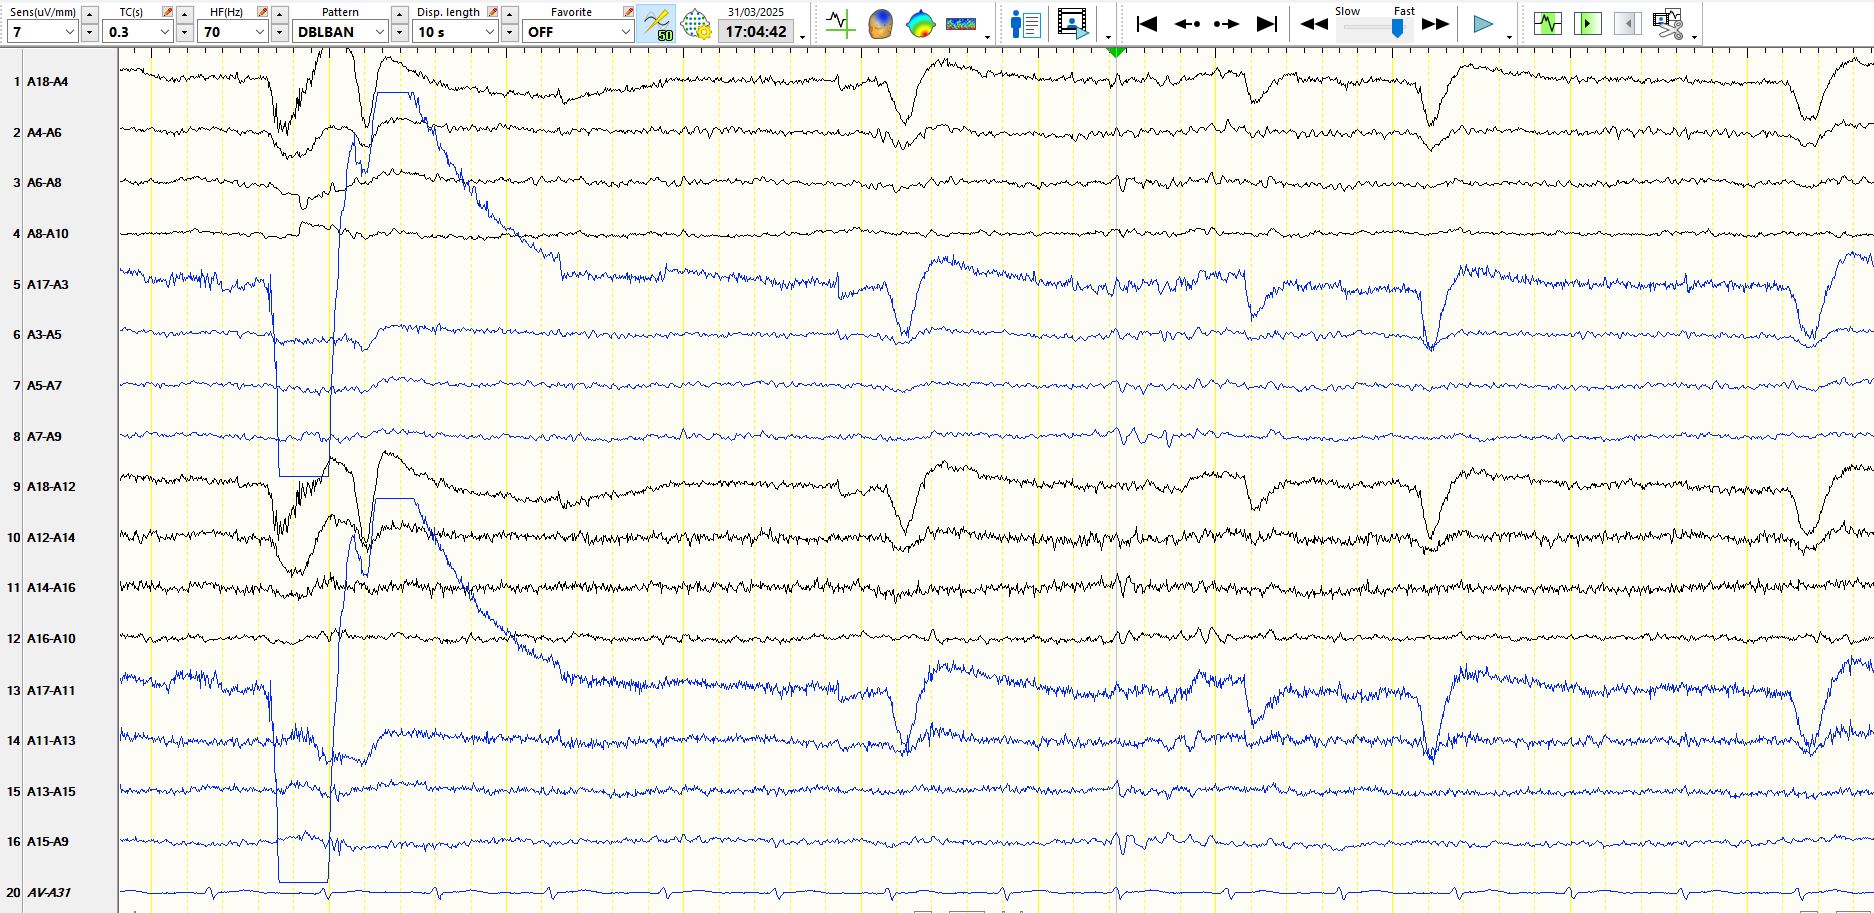
The above is a representation of the previous pages in the referential montage. The first arrow highlights subtle EMG artifact prefrontal derivations, the 2nd arrow is above a probable low amplitude F-wave, the 3rd arrow demonstrates that this apiculate waveKateform represents EMG artifact while the 4th waveform demonstrates an electropositive Vertex wave. The referential montage demonstrates the electropositive V-wave, followed by spindle. The sharply contoured theta and delta waves can be seen at F7-M1 (left anterior, inferior temporal region).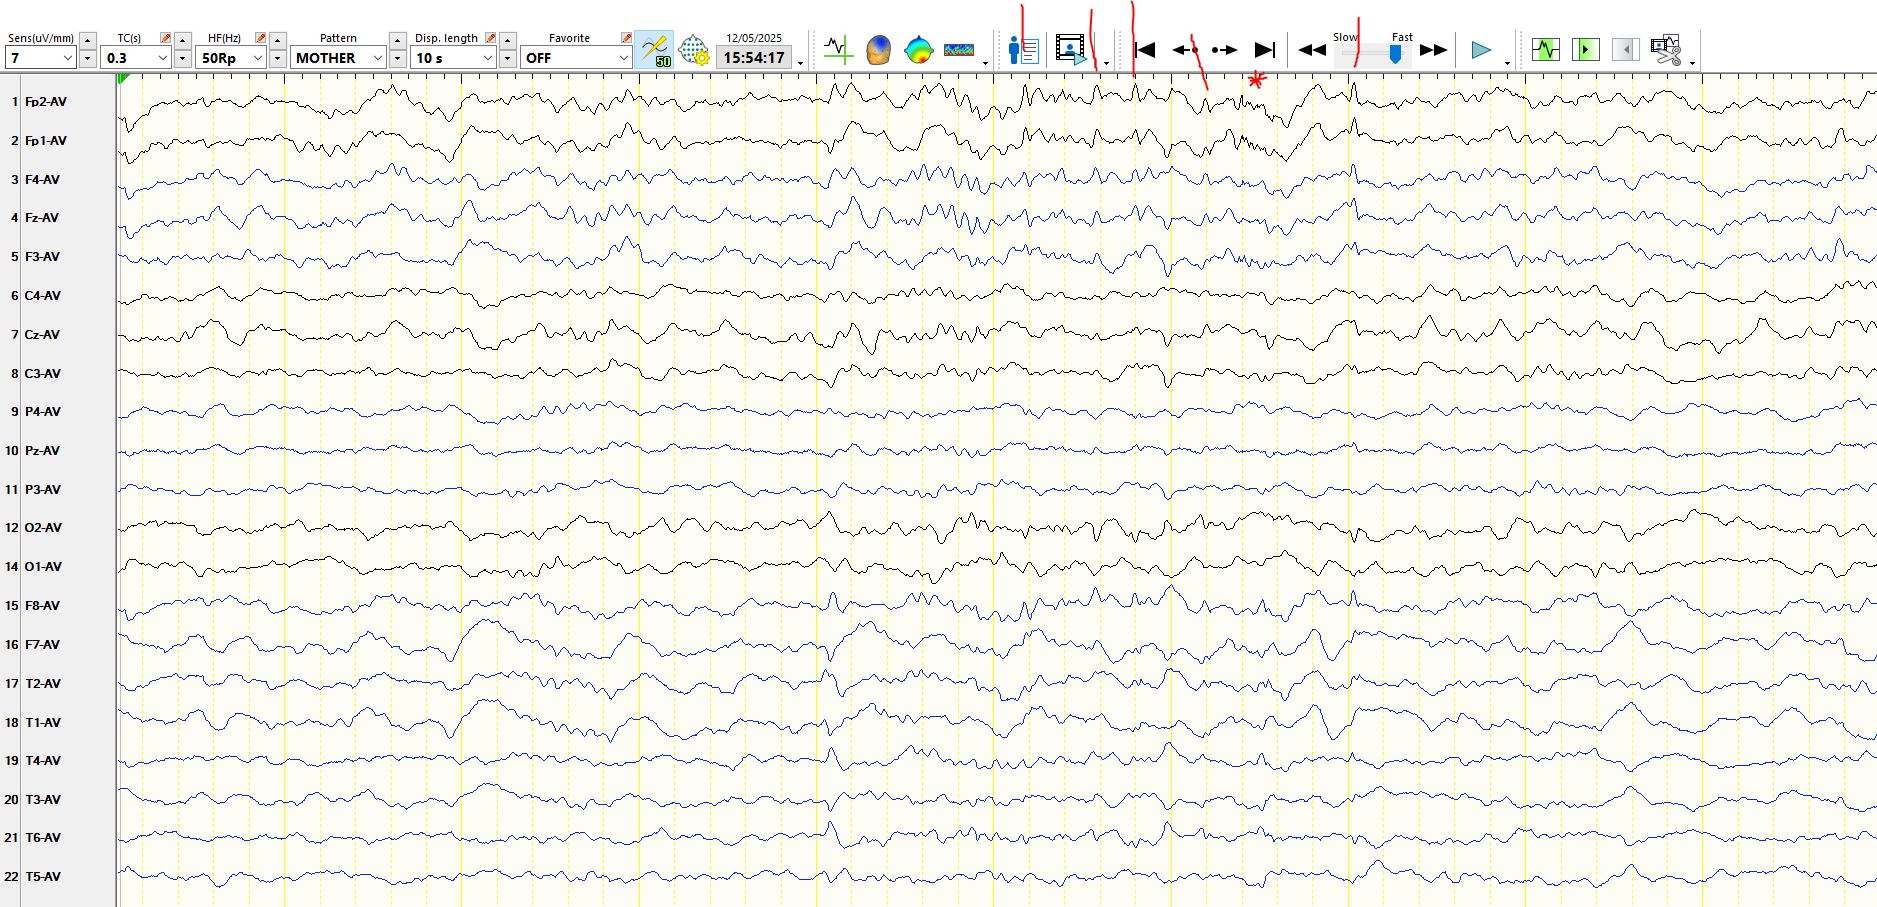
In the image above probable sequential F-waves have been marked. Low amplitude EMG artifact (*) is also present.
In the above image there is a spike at F7-M1-T3, preceded by several delta waves of variable frequency and followed by a delta wave. The patient gives a history strongly predictive of non-dominant temporal lobe epilepsy. The spike is immediately followed by a V-wave (milliseconds later).
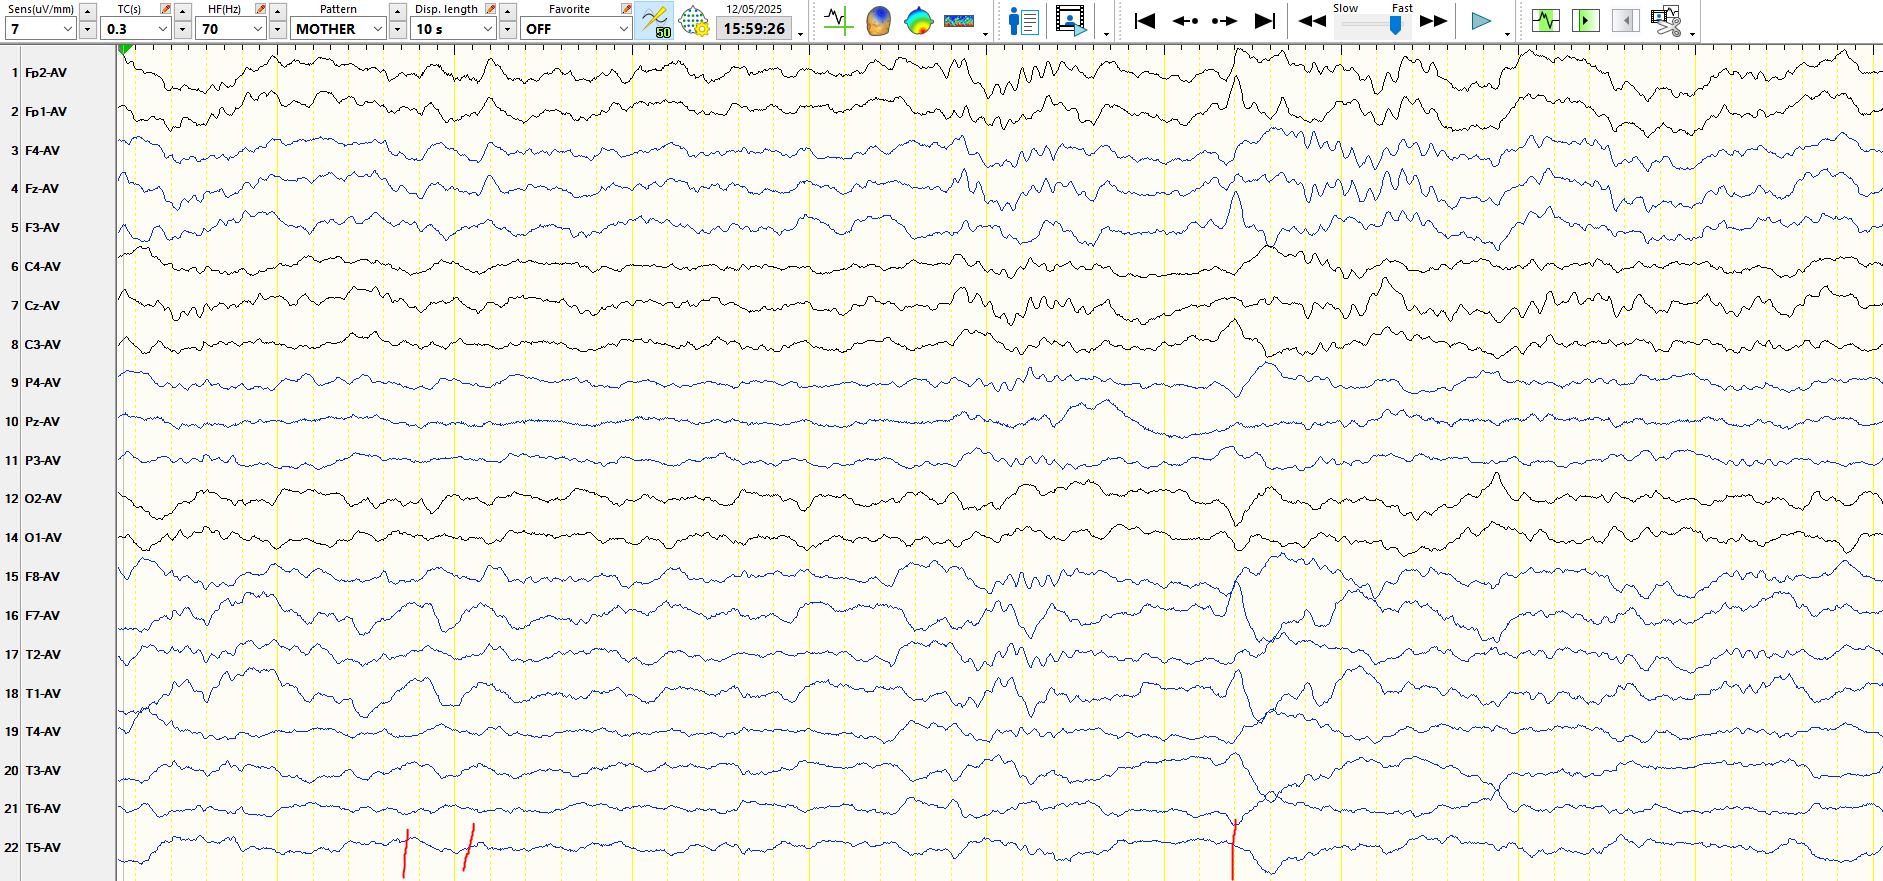
Above: 2 sequential delta waves at F7-M1 (Left anterior, inferior temporal region, 1st two red lines) and a single sharp wave (arrowed) at F7-M1-F3-FP1 (Left anterior temporal/lateral frontal) in sleep.
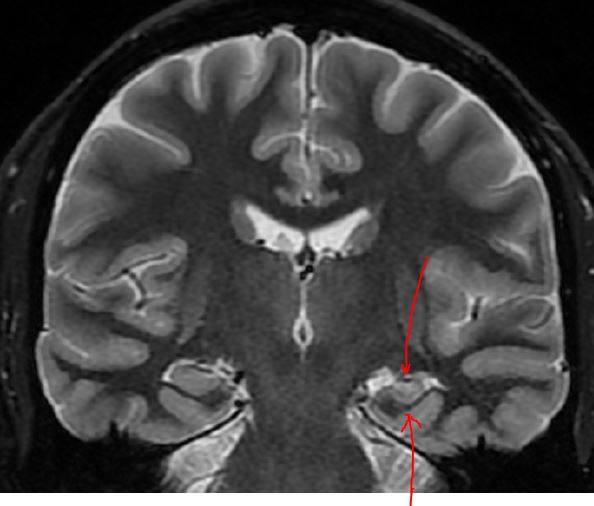
The MRI demonstrates atrophy of the body of the left hippocampus in the image above, with increased signal on this T2 weighted image stop
The following EEG is from a different patient, 34y, with medial parietal lobe epilepsy. Contrast this EEG with the second page of EEGs from above: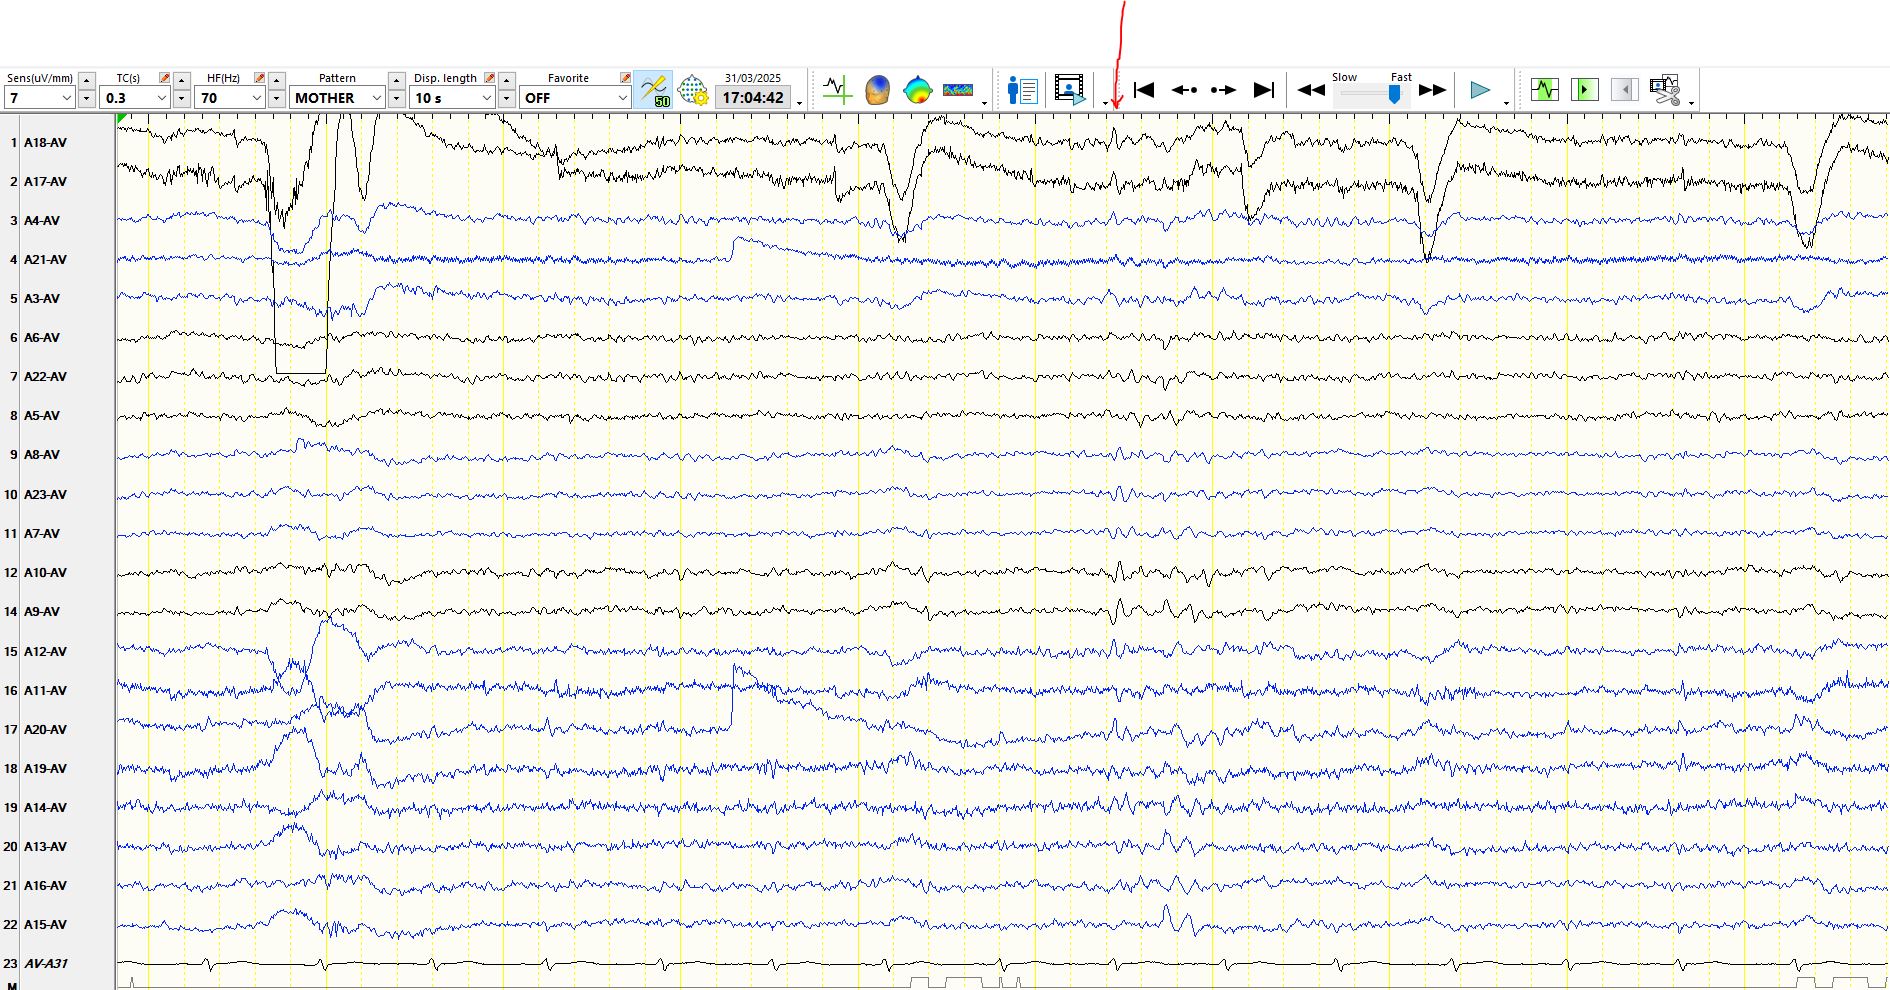
During the first 5 seconds the patient is fully alert. The electro-negative sharply contoured waveform that appears at FP2-FP1 is synchronous with the onset of generalised slowing of background rhythms, indicative of very mild drowsiness (eyeblinks continue to occur). This is simply anterior propagation (and progressive slowing) of alpha rhythms and hence this sharply-contoured waveform is part of alpha. In the page above and below (same page), the waveform is electro-negative anteriorly at the same time as there is a probable electropositive waveform in the occipital regions (one has to be a little careful on the common average montage that there is not reference contamination). This issue is easily resolved on a bipolar montage (see further below).
This dipole is confirmed when the above page is represented on the bipolar montage, seen below: