11y
May 24, 2025Is the following abnormal? If so, what is its nature?

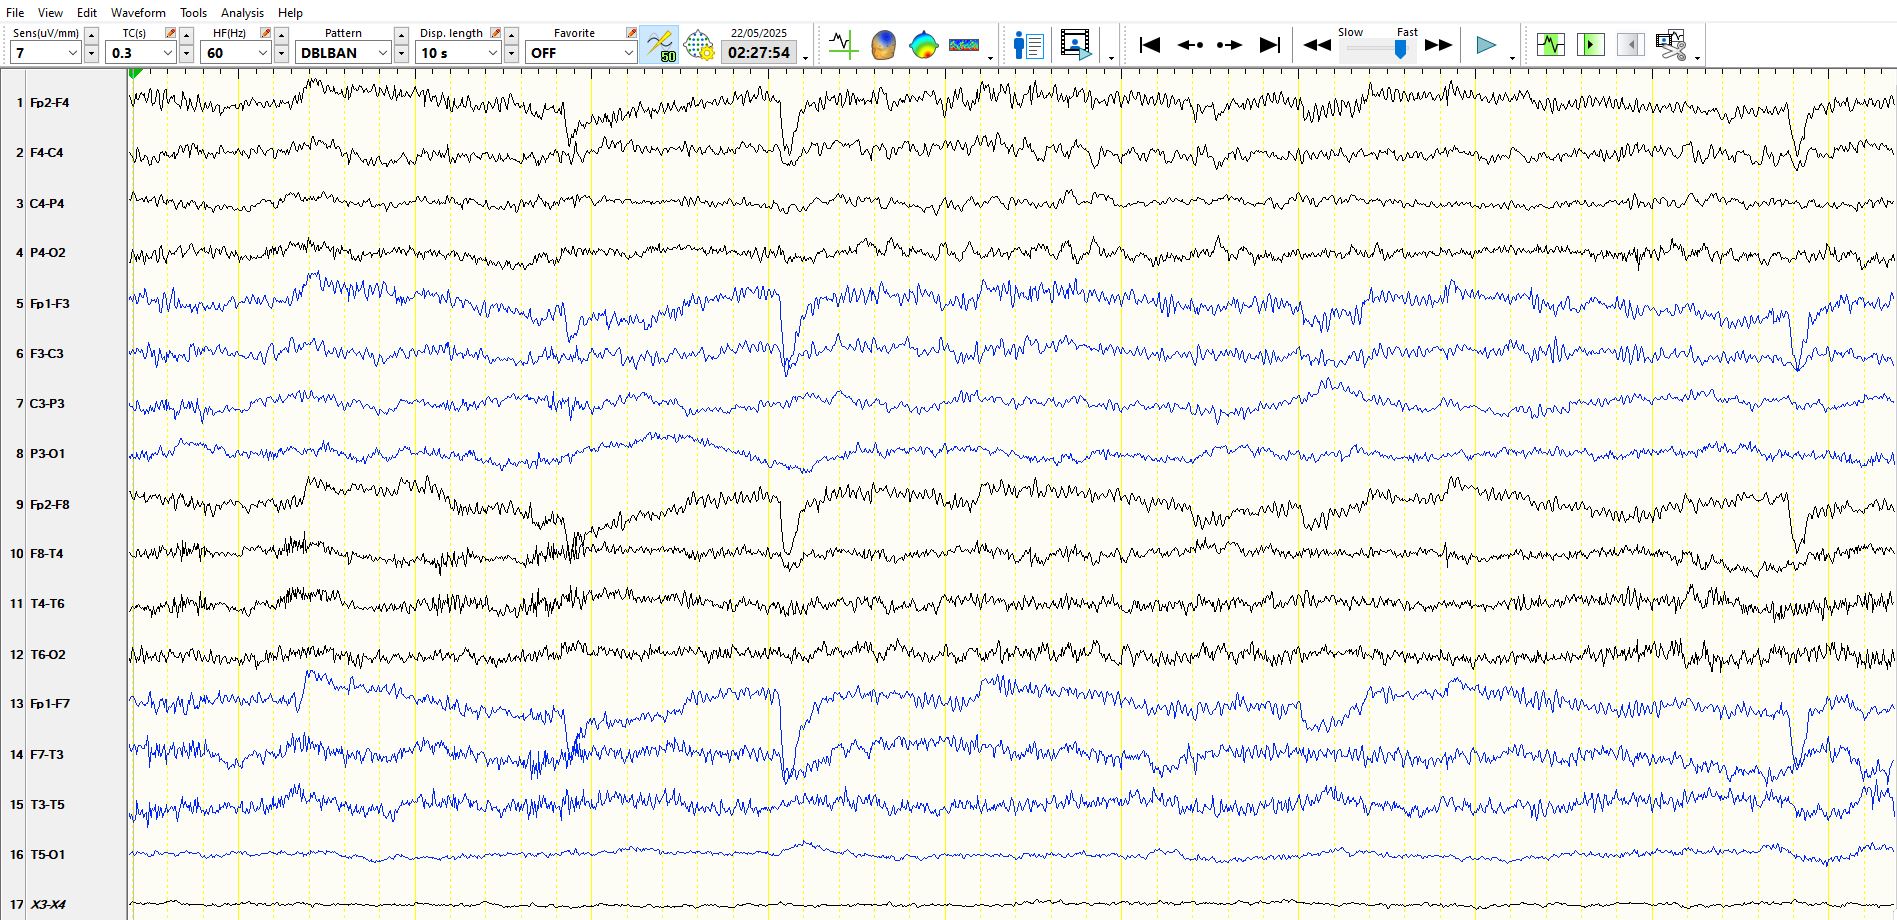
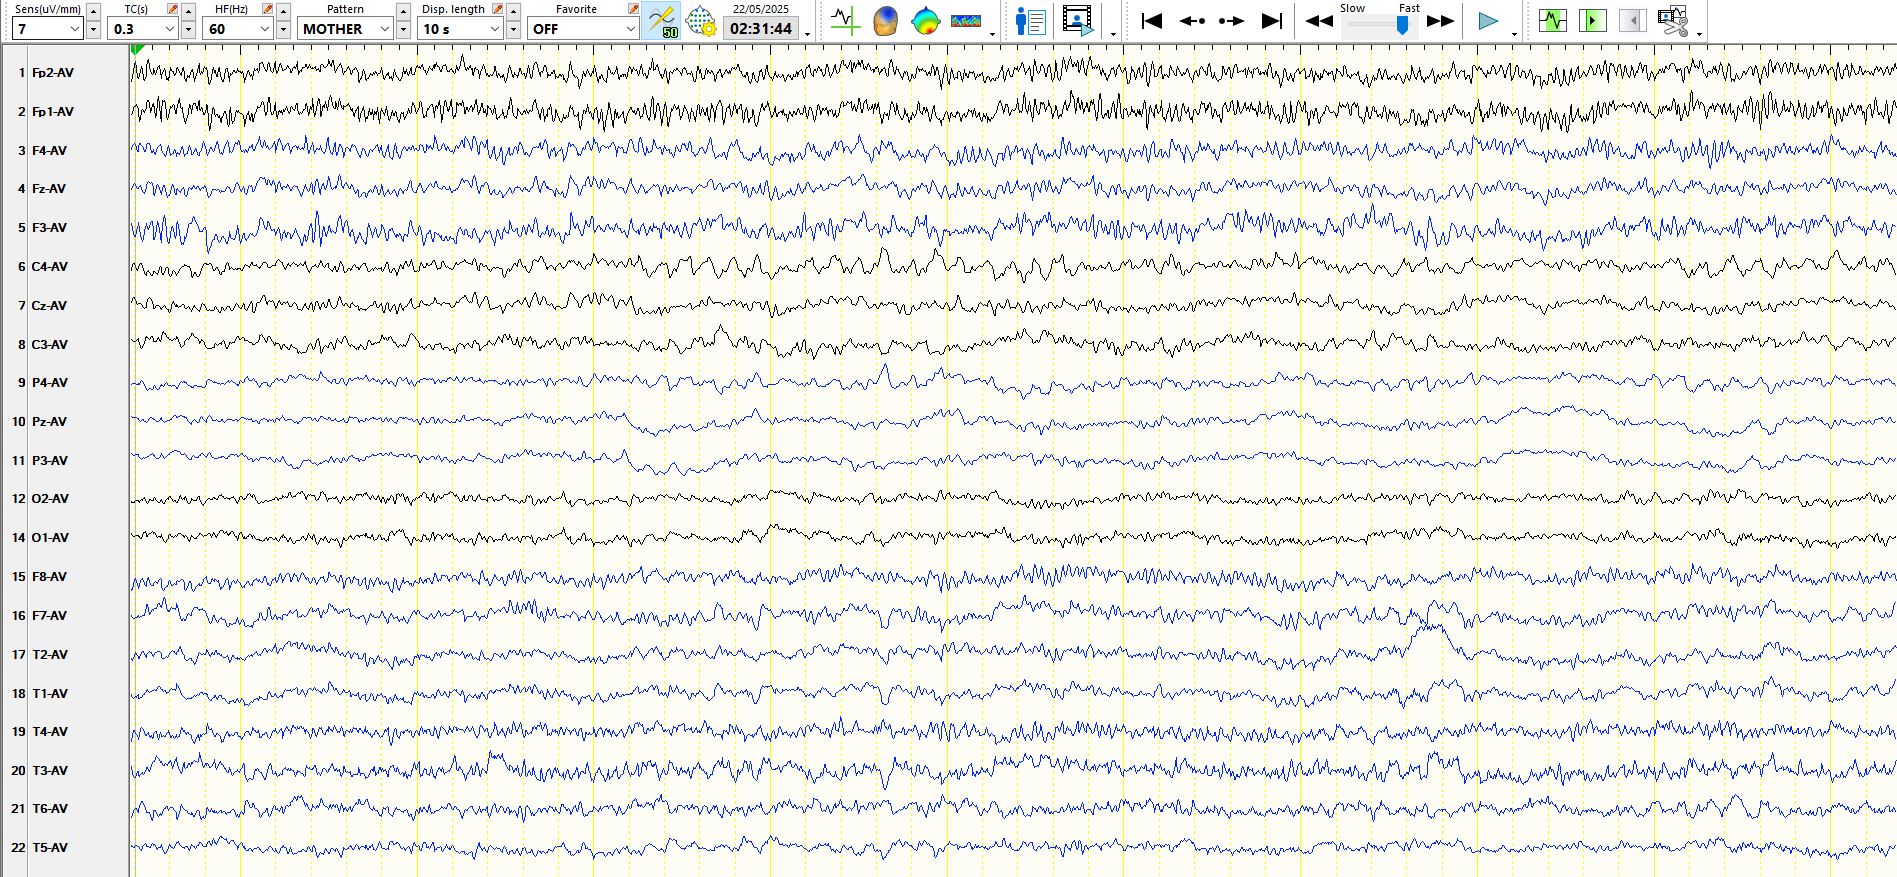
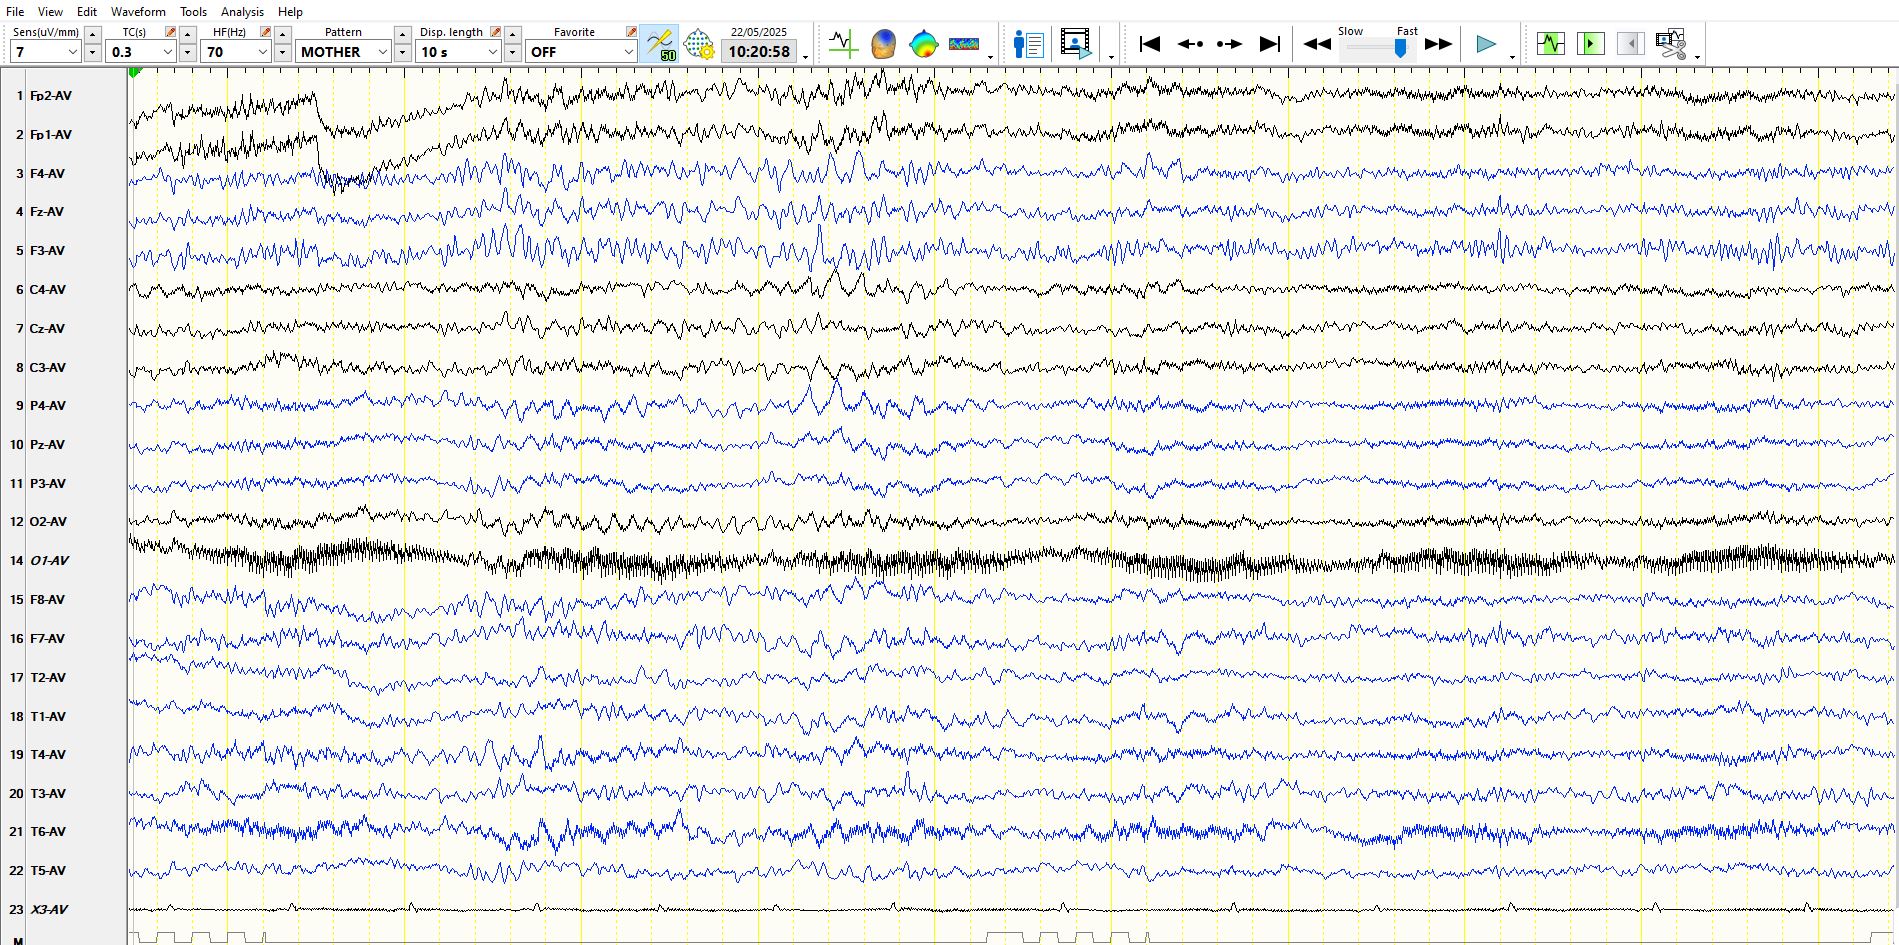
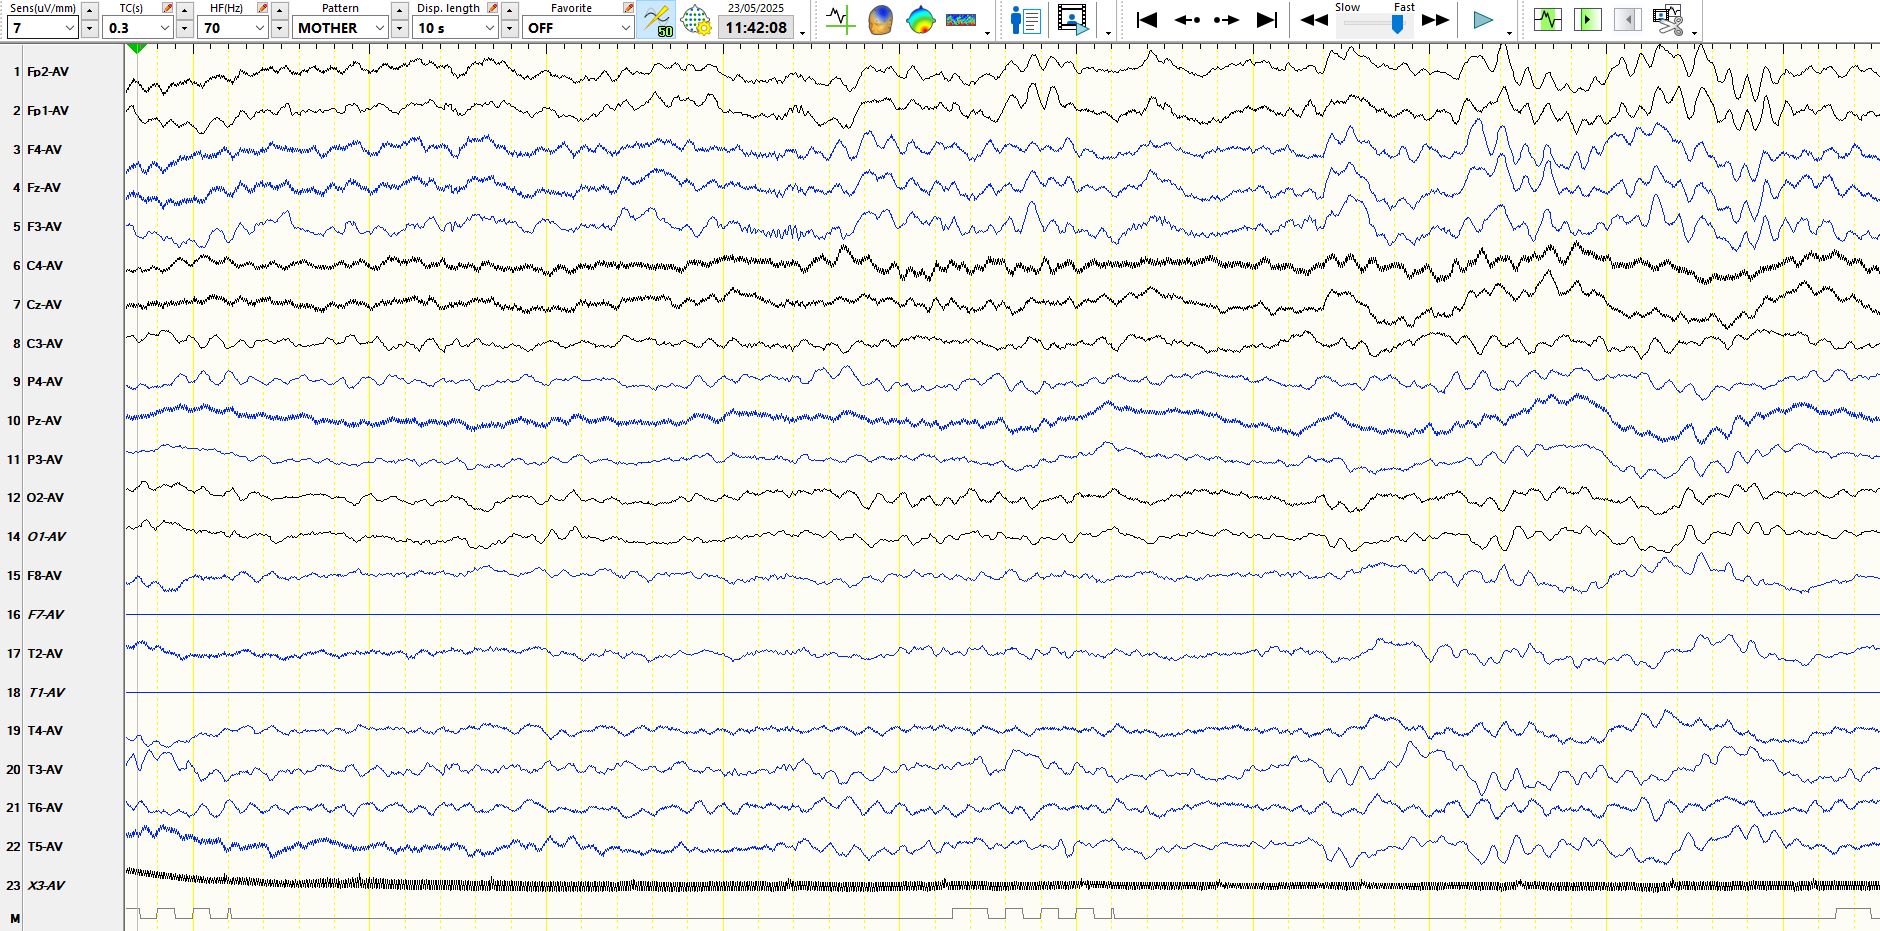
There are two observations worth mentioning. Background rhythms (approximately 7.5 Hz frequencies) are well developed in the right central region (C4-P4) and absent on the left (C3-P3). This discharge progressively increases in amplitude and slows in frequency, which you may think is a seizure. Notice that the amount of EMG artefact diminishes in the temporal derivations at the time that this occurs, indicating subtle drowsiness/relaxation) and that the background frequencies continue in C4 and P4 until the end of the page, without any evolution, negating the possibility that this is a seizure. Distinct from the EMG seen in channels one and two, the beta frequencies at F3 are consistently higher in amplitude than at F4, raising the possibility of a spurious asymmetry or a breach rhythm. There is a partial electrode artifact a P3, but this does not explain the asymmetry, which is also present in the central and posterior temporal regions.
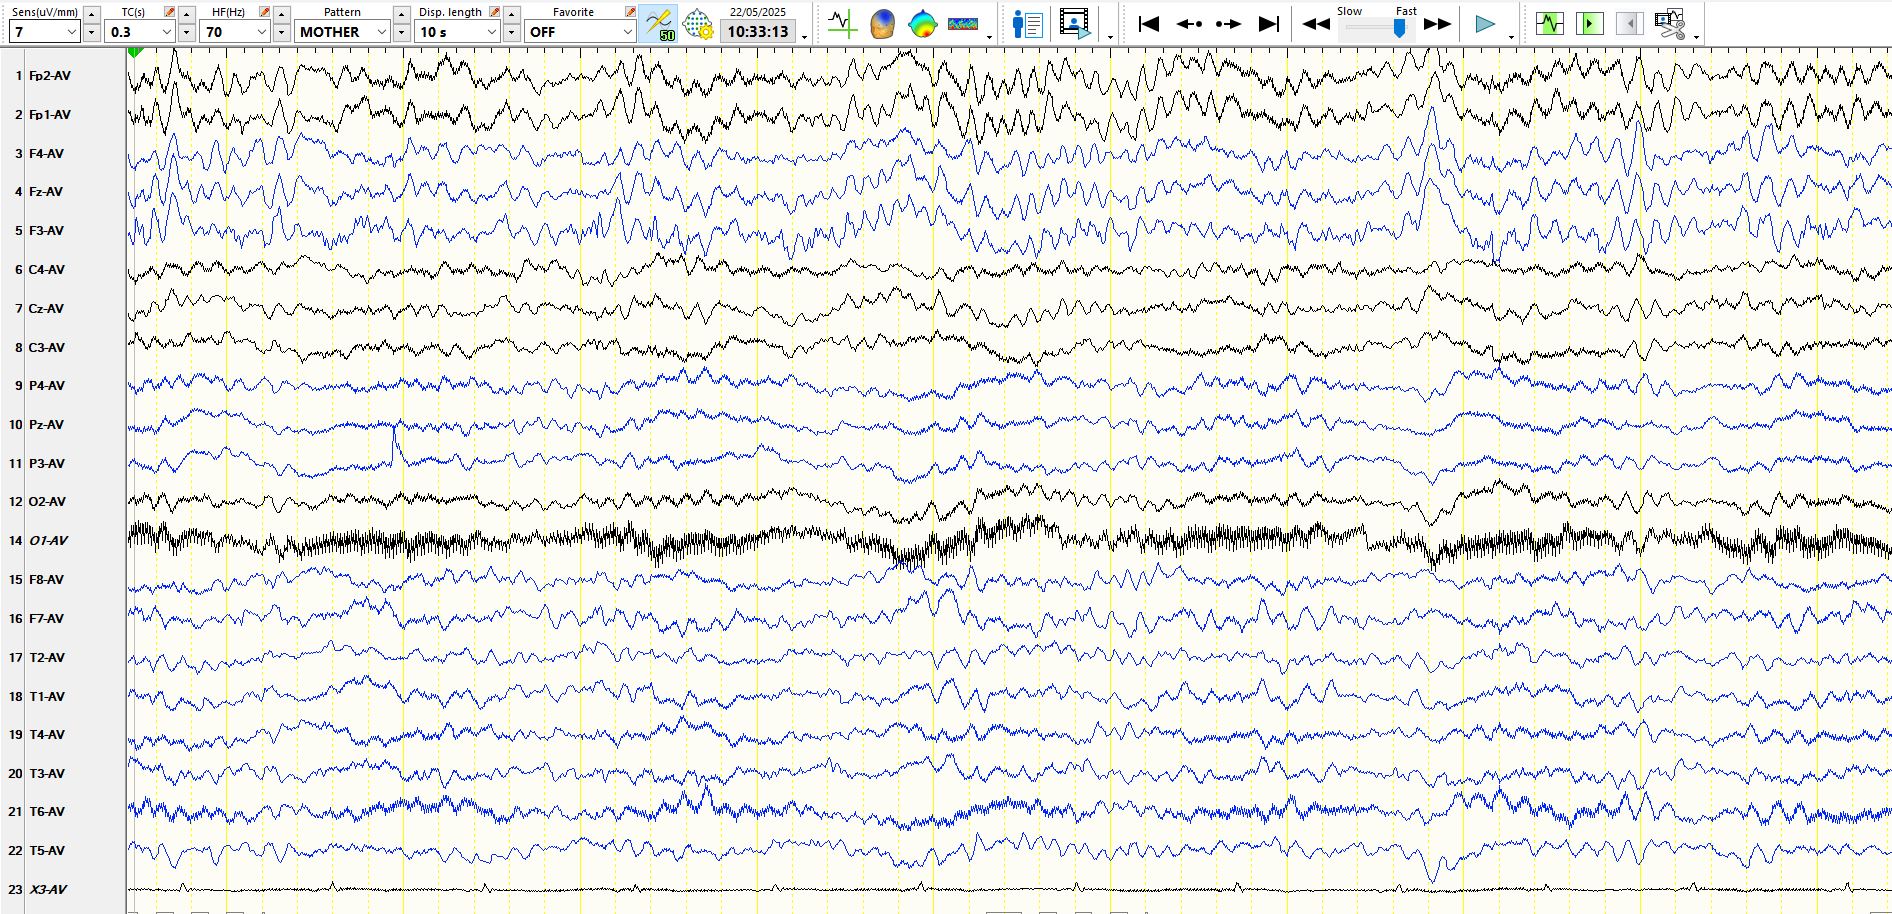
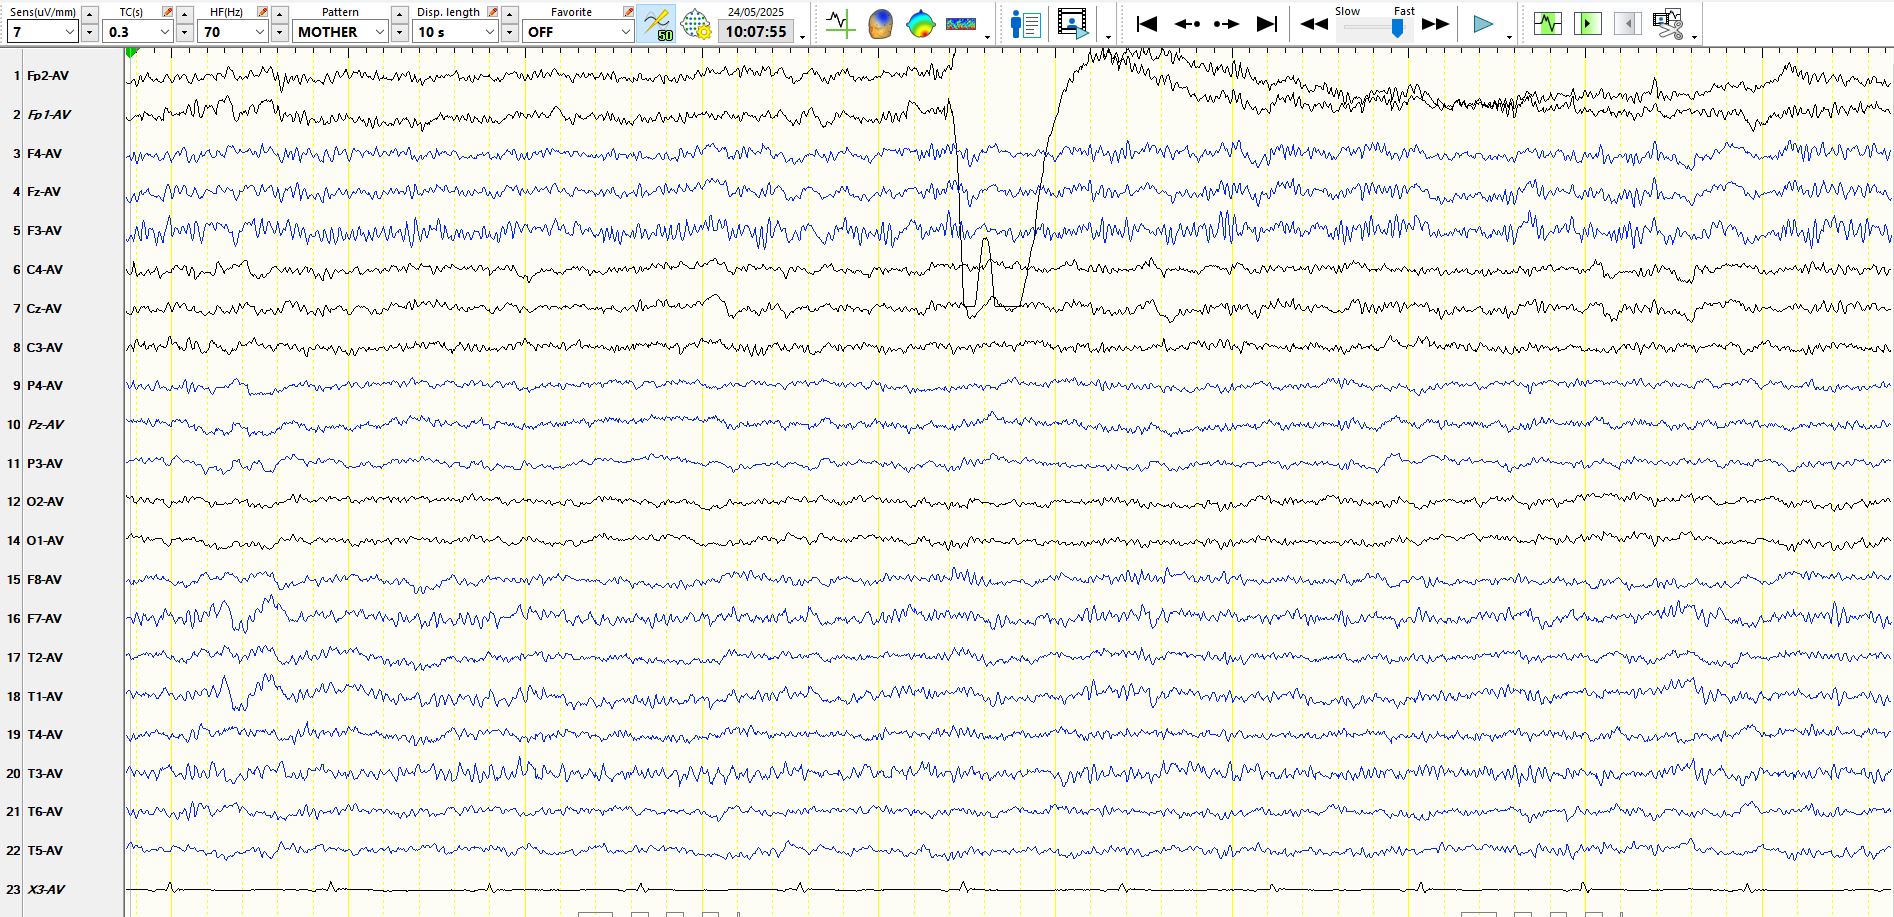
Awake, a different epoch and a different montage:
In the above, the asymmetry of background rhythms is once again apparent, providing further evidence that the left hemisphere is dysfunctional.
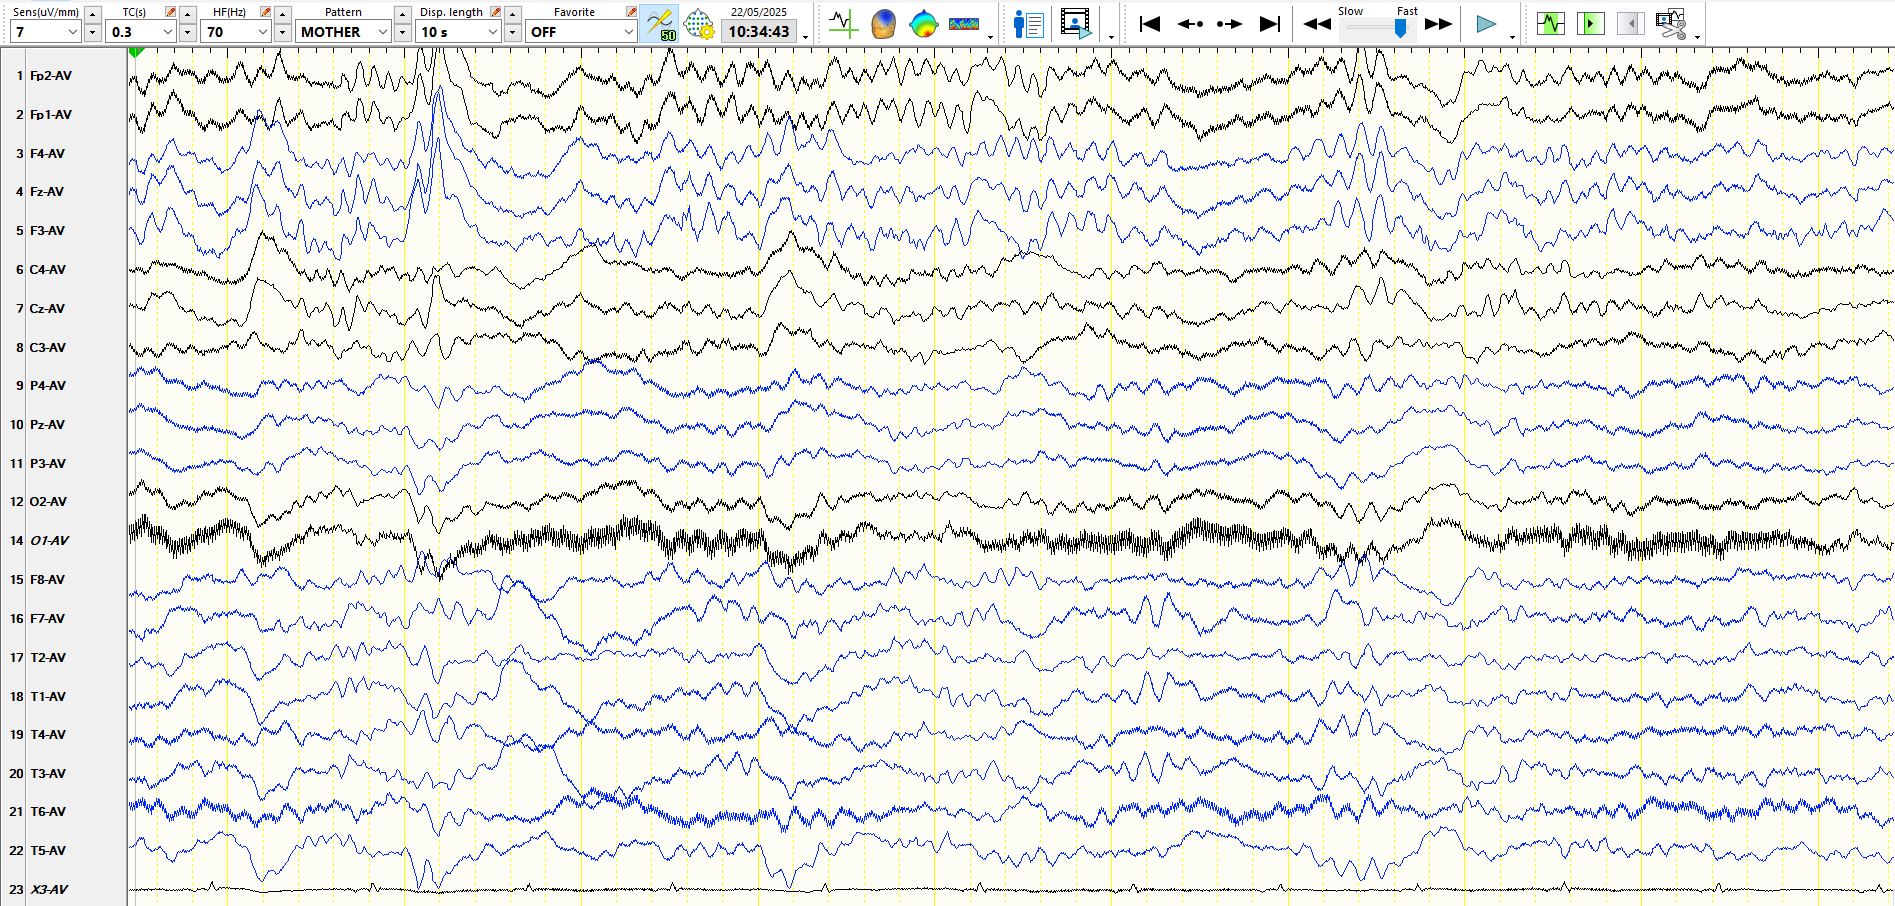
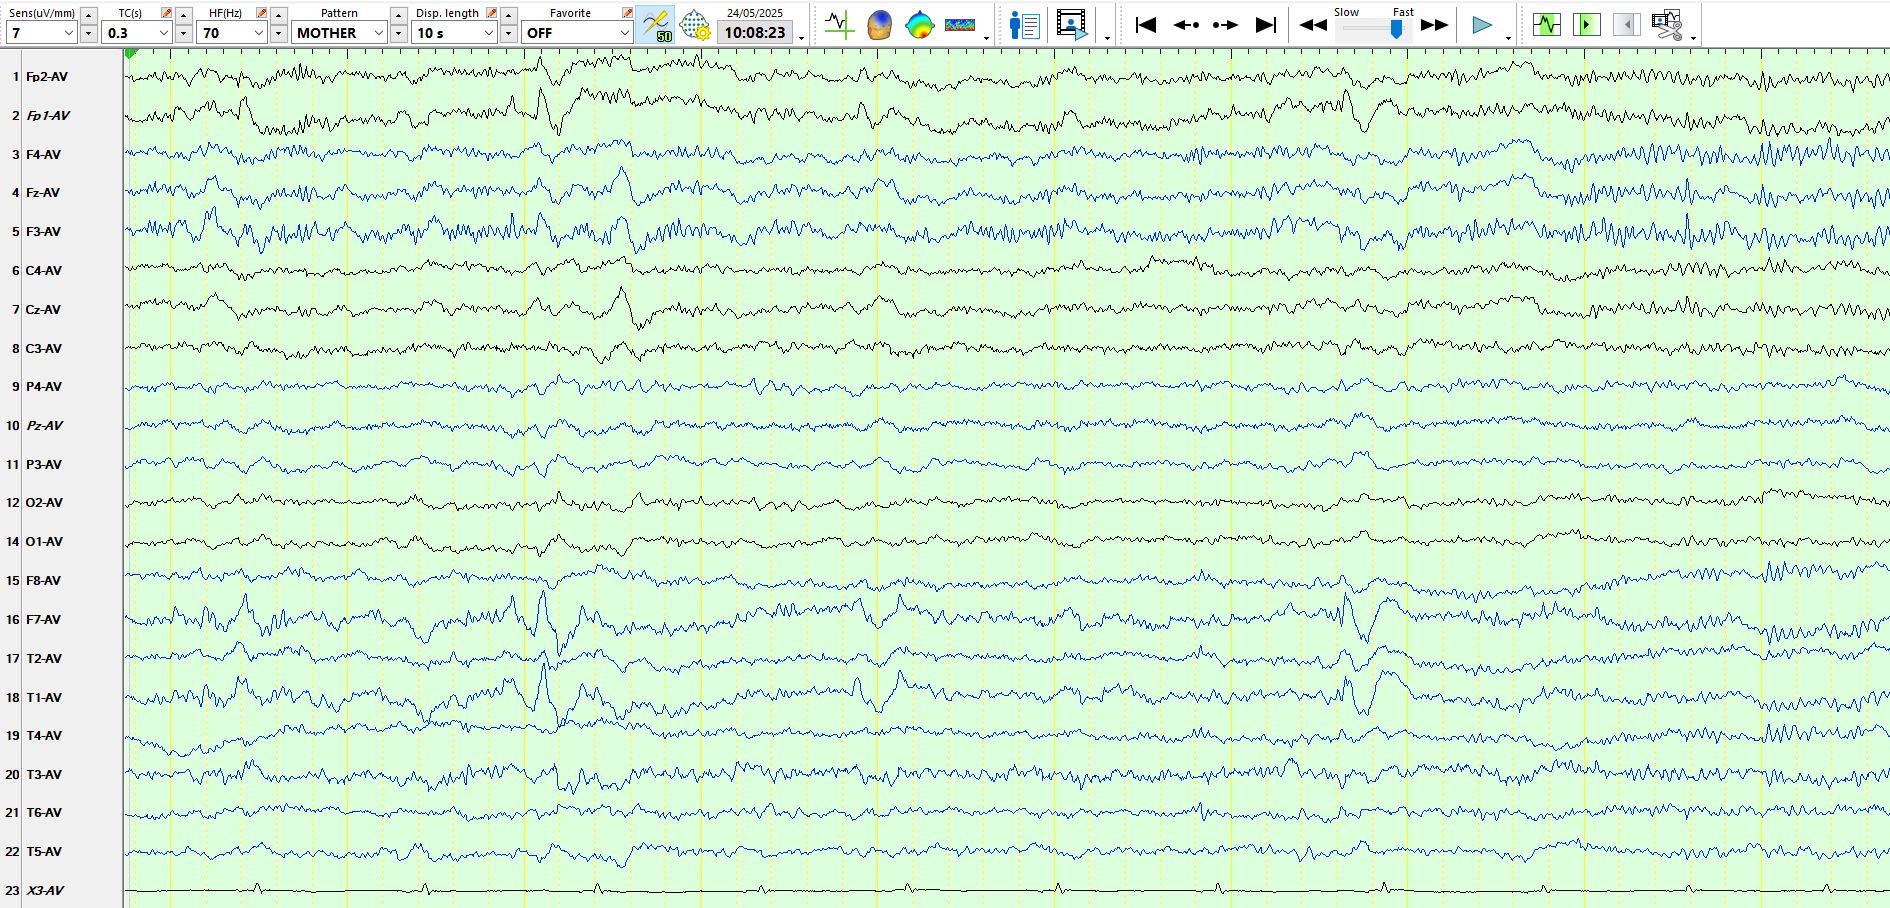
A different page:
The above page in the referential montage. Notice that, compared to the bipolar montage above, the referential montage demonstrates a clear difference in the amplitude of F3-FP1 versus F4-FP2
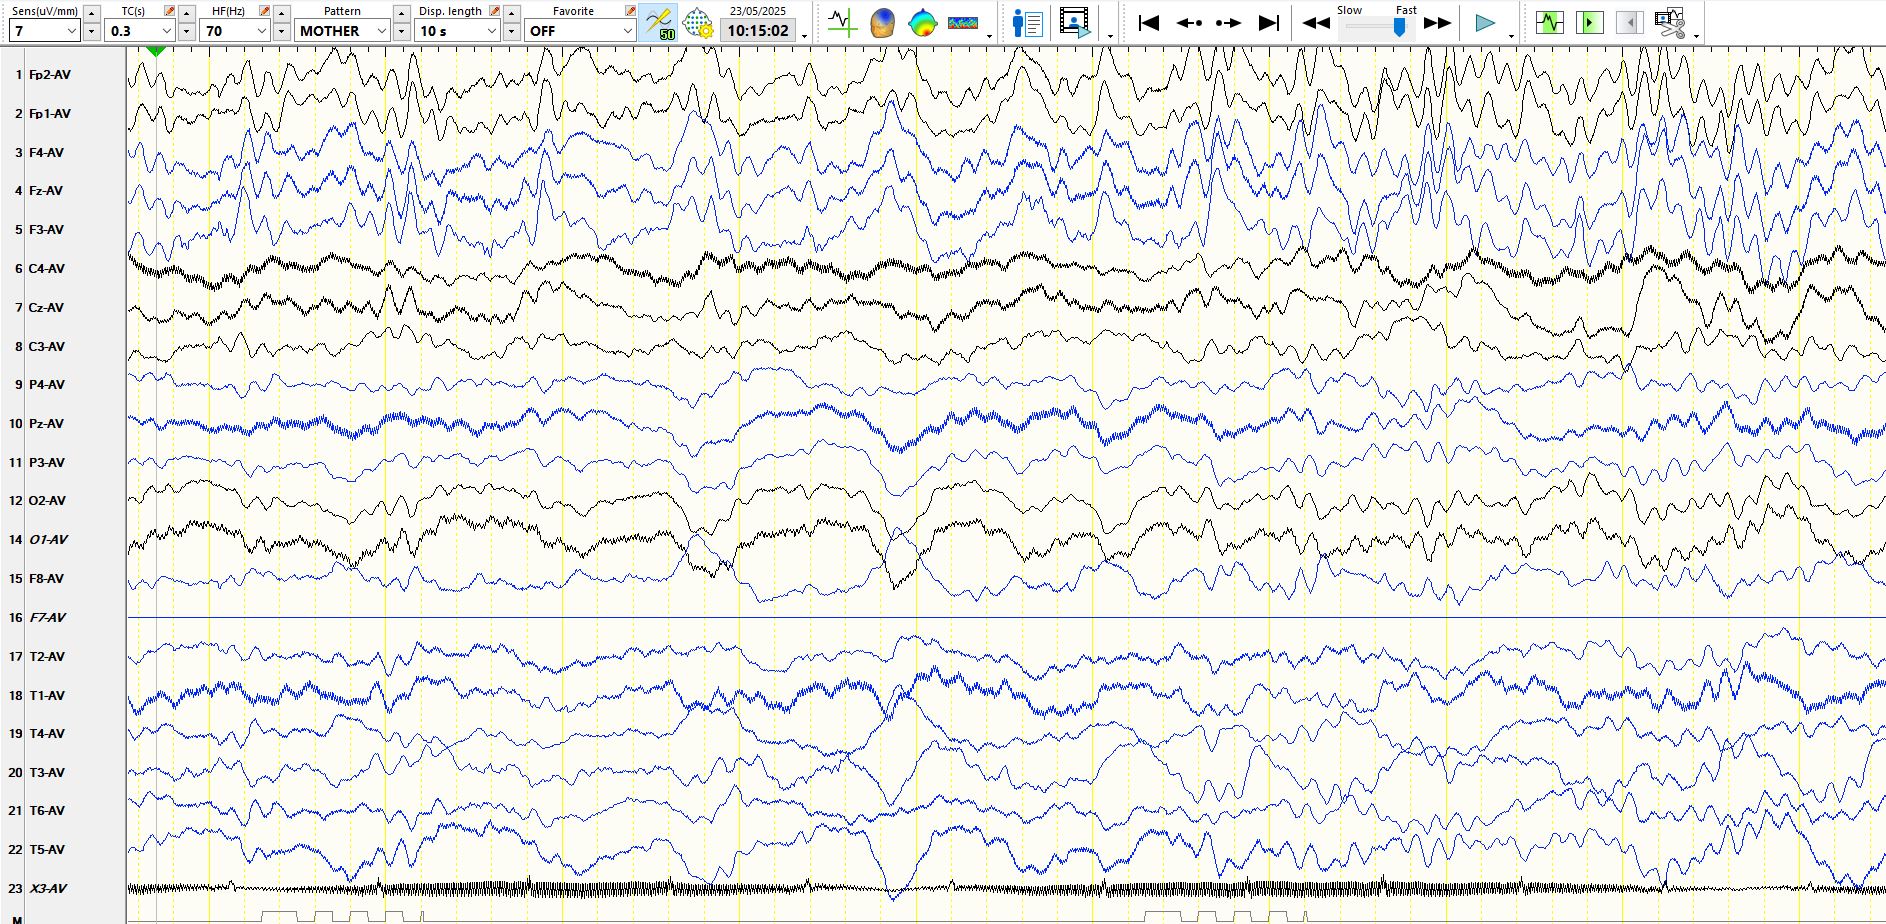
A different page: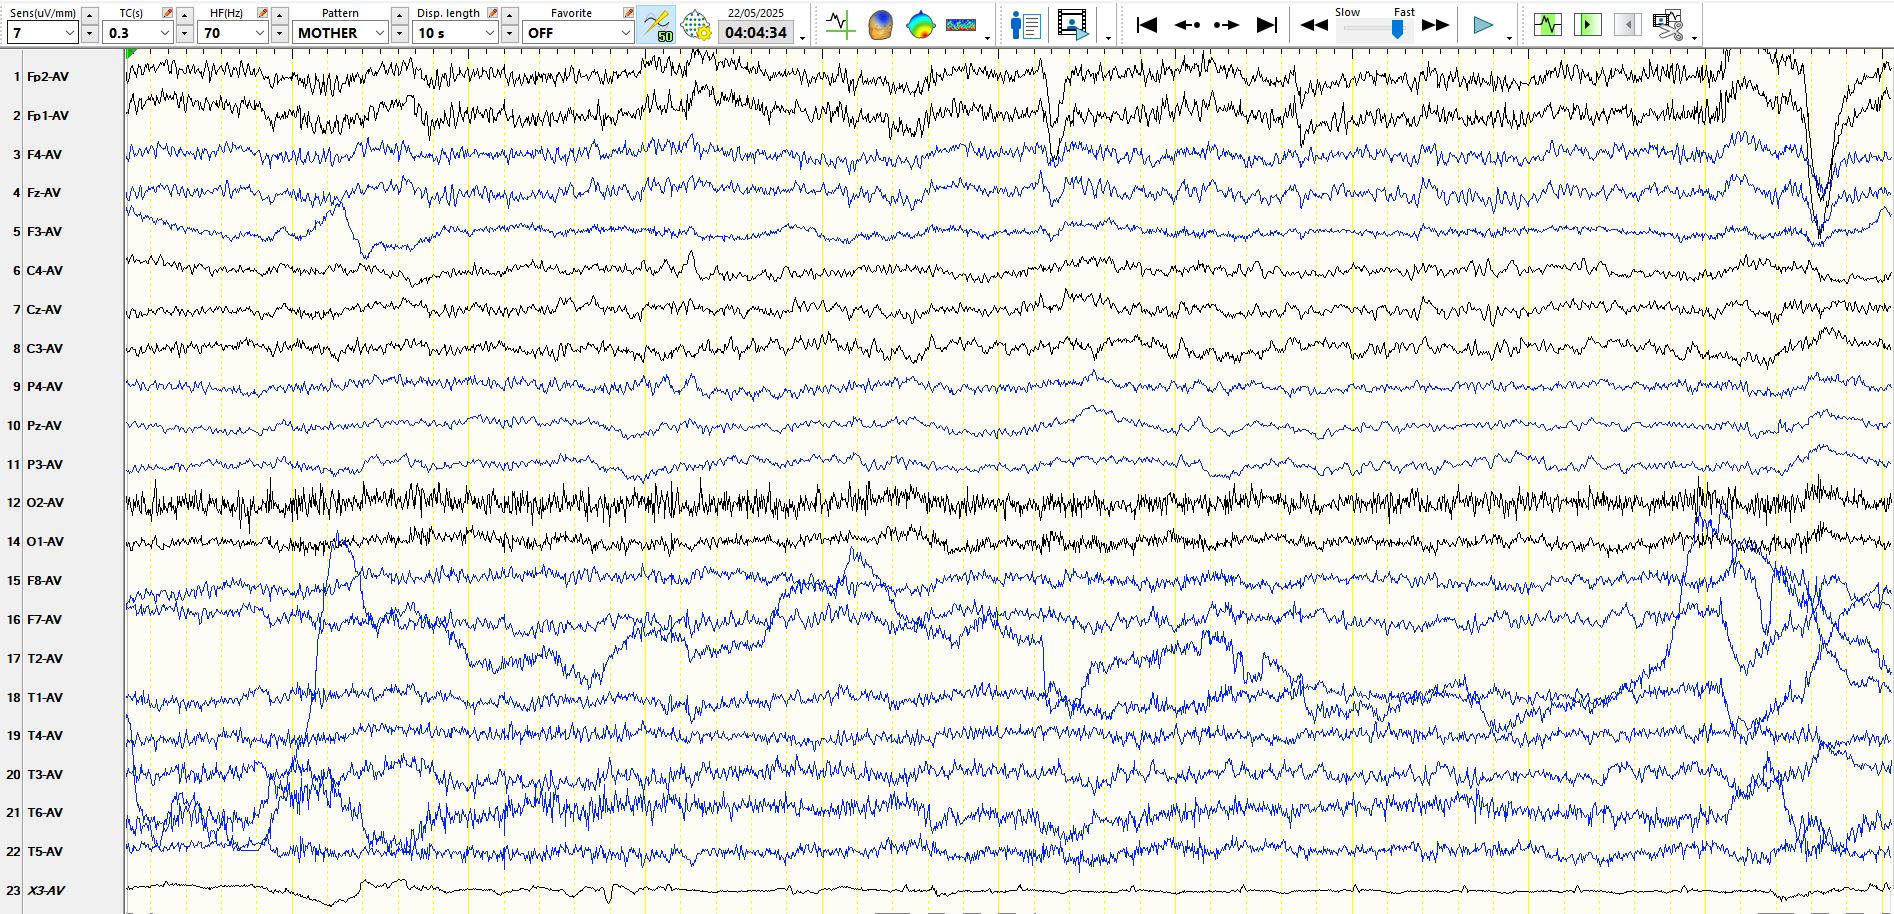
In the above, and electrode artifact at F3 obscures the asymmetry of beta frequencies, while there is some evidence that the left central region is capable of generating some faster frequencies

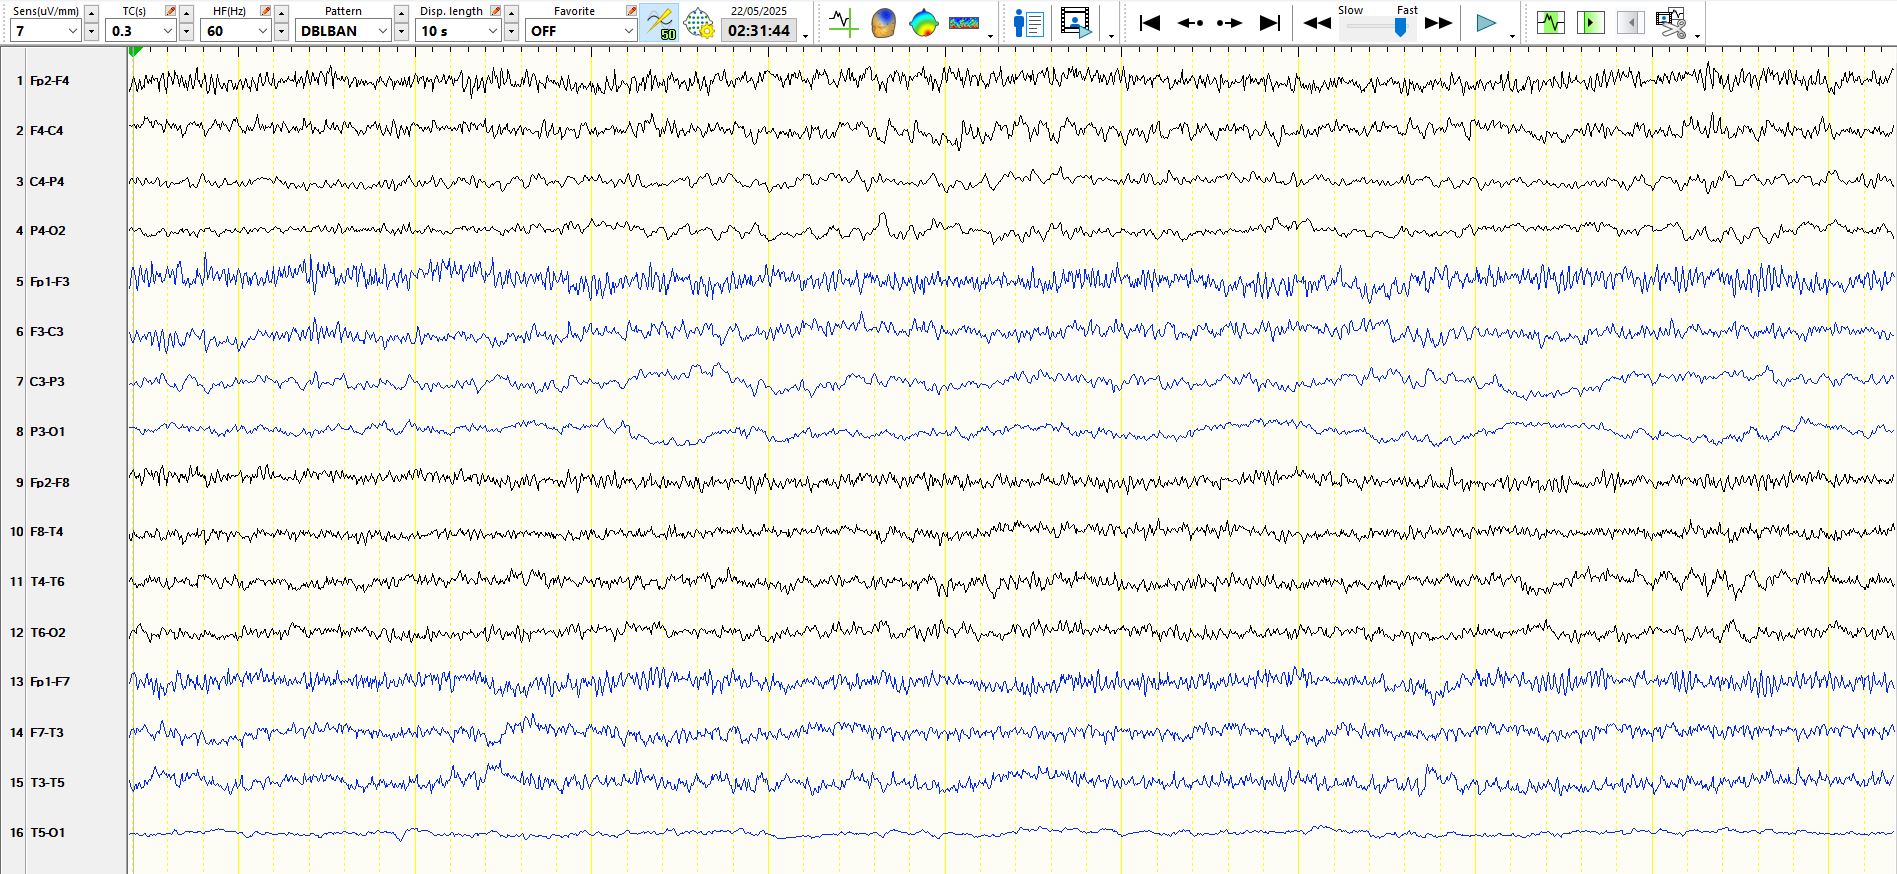
in the above, the asymmetry of alpha and beta frequencies is once again evident
In the above, the asymmetry of central alpha frequencies persists. The asymmetry of beta frequencies can be seen in the first second of the page, but is not evident thereafter as diffuse beta frequencies become more prominent
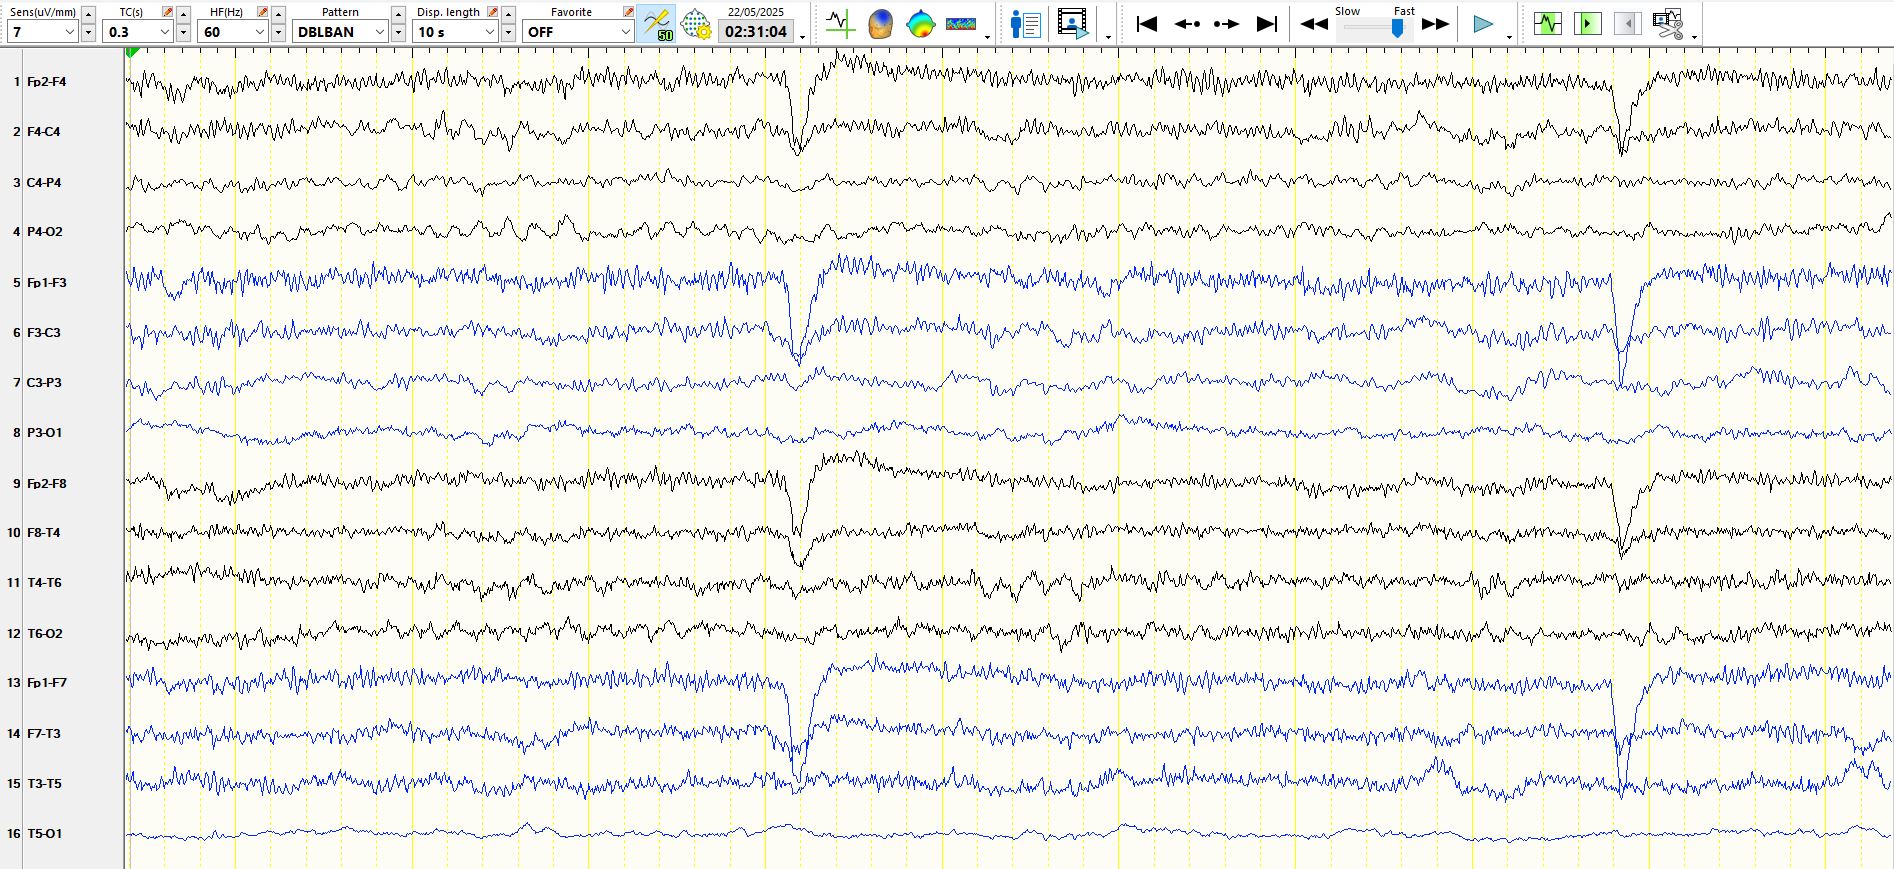
In the above, as the patient becomes drowsy, with a diminution in the amount of EMG artifact, cessation of eyeblinks and some slow eye movements at the end of the page, the asymmetry of beta frequencies (F3-F7-T3 versus before-F8-T4) is once again evident
In the above, as the patient falls asleep, the asymmetry of beta frequencies between the superior frontal regions as well as the slowing of alpha frequencies and emergence of beta frequencies at C4-P4-T (a normal feature of drowsiness) provides further evidence for an asymmetry, suggestive of intrinsic central-parietal-posterior temporal dysfunction (01 is artifactual and hence one cannot comment on the occipital region)
stage II sleep:

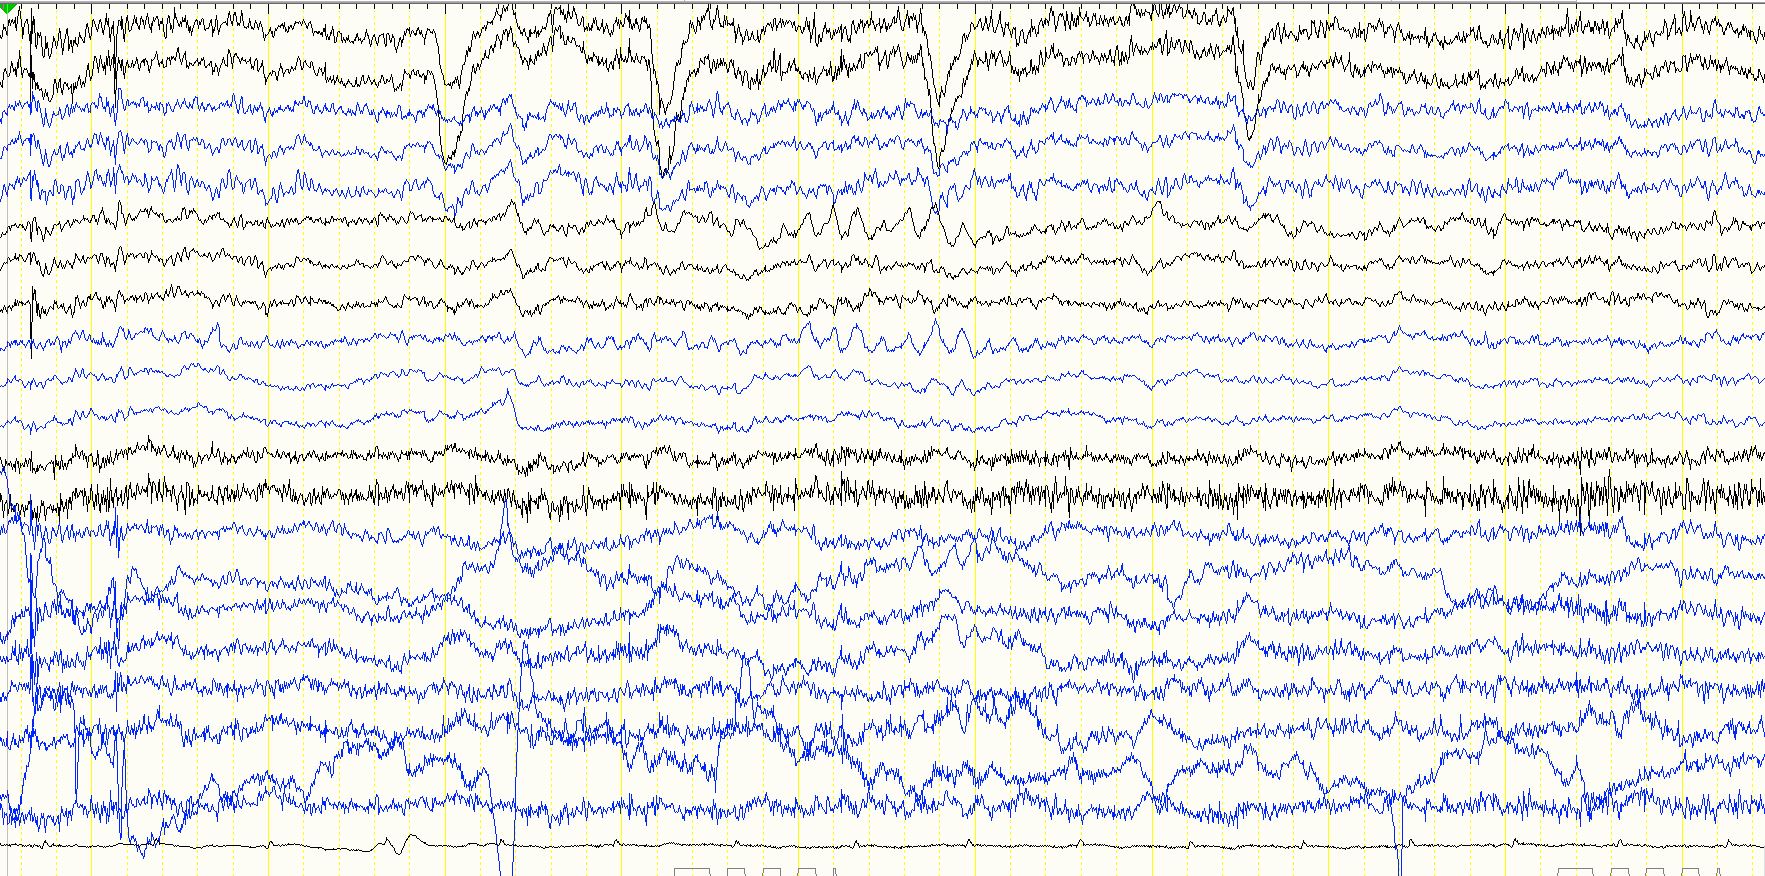
In the above, beta frequencies are generally difficult to see at this stage of stage II sleep, with the exception of F3 (note especially the last two seconds of the page). This is not artifactual, as there is very subtle involvement of FZ. In the first five seconds of the page there are some low amplitude bursts of high frequencies; these either represent very low amplitude polyspikes (they can also be seen at FZ, providing assurance that they are of cortical origin) or they represent waxing and waning of beta frequencies in the area of the breach rhythm. One must be very careful about calling any sharp wave or train of sharp waves an inter-ictal epileptiform discharge in the setting of a breach rhythm. A good rule of thumb is to ensure that the discharges are at least three times greater than the greatest amplitude of the background rhythms in this area. This is not the case here
Similarly, the apiculate waves at F3-FZ should not be called spikes/inter-ictal epileptiform discharges as there almost certainly is a breach at F3
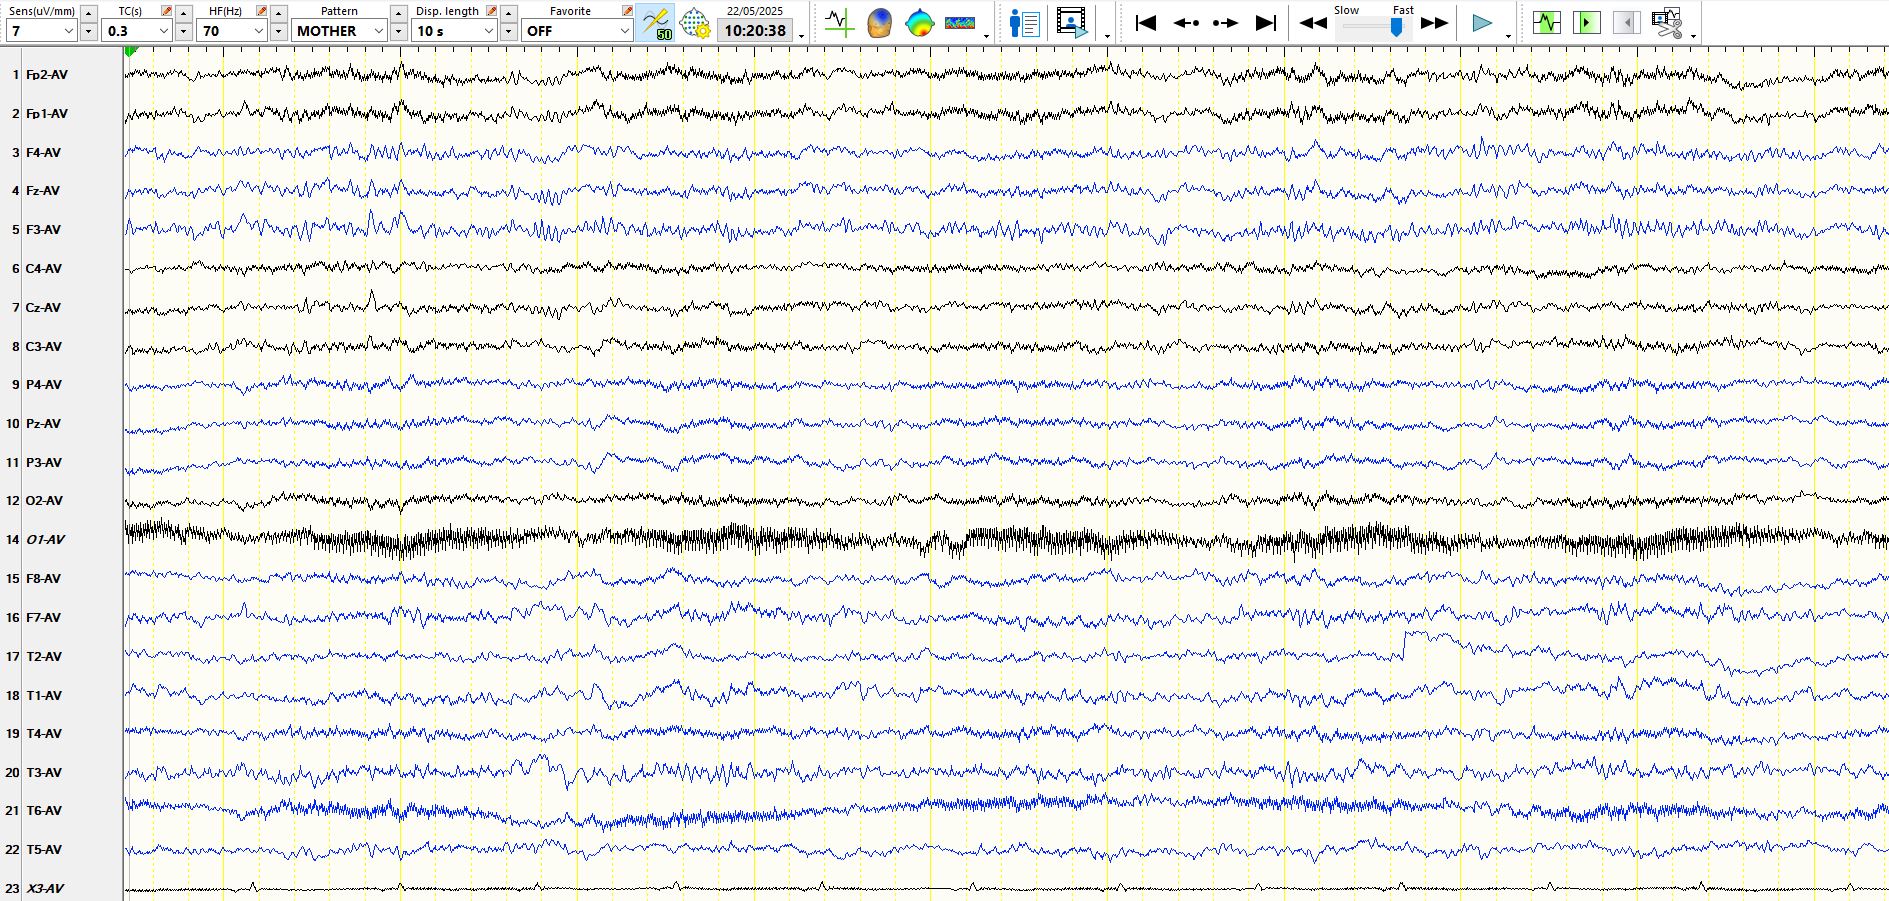
In the following two pages, the absence of beta frequencies generally obscures the asymmetry
In the fourth second a small amount of beta appears transiently at F3-FZ, with the same hallmarks as beta above
In the above, when beta is plentiful and EMG is minimal (drowsiness), the asymmetries are apparent. Just for good measure, on the left-hand side of the page there are two sequential theta waves at F7-M1
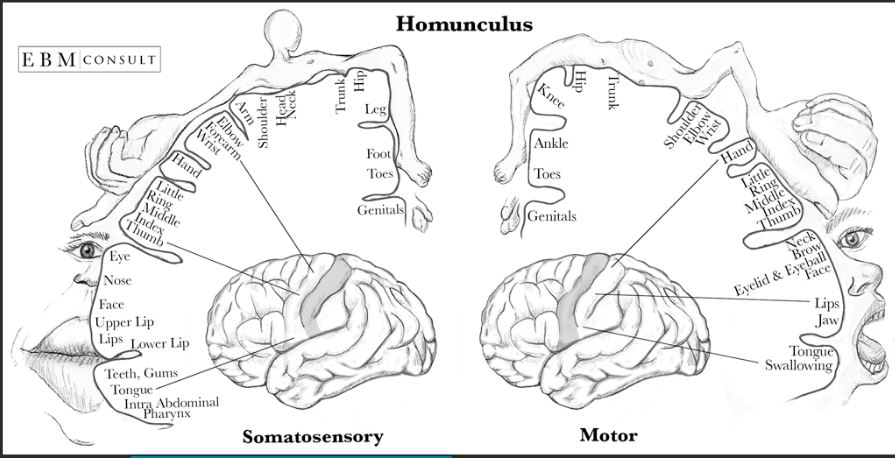
In the image above, theta waves and 2 definite spike-and-wave discharges appear several days after the commencement of video-EEG recordings, following a prolonged focal aware seizure (consisting of a feeling of hair in the mouth, with retained language function, awareness and responsiveness; on video she made chewing movements. The semiology is easily mistaken for a medial temporal lobe seizure). The seizure likely was circumscribed, involving the inferior aspect of the post-central gyrus ( at the bottom of this page there is an illustration as a reminder of the sensory homunculus). There was no EEG change during the seizure. Note the low amplitude V wave just after the first spike.
Bottom line?
Keep an eye out for asymmetries. Sometimes it is difficult to judge which hemisphere is dysfunctional. An analysis of the background rhythms is the most important clue. Alpha frequencies may slow into the theta range during periods of quiet repose/drowsiness, leading to further doubt about the side of dysfunction. Beta frequencies may be suppressed by severe cortical dysfunction, but equally maybe increased in amplitude following a breach of the skull, as appears almost certain in this case.
Breach rhythm: the EEG related to skull defects - PubMed
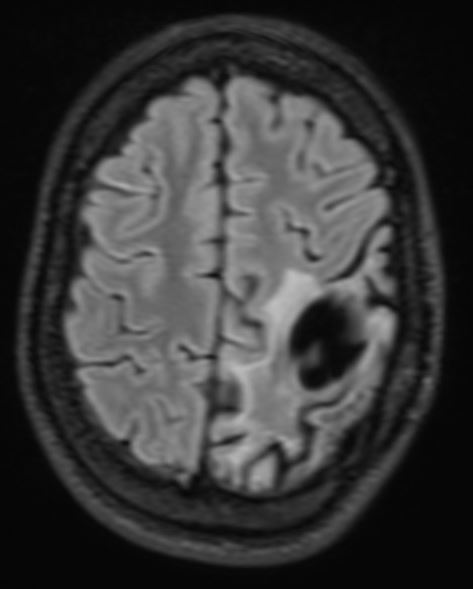
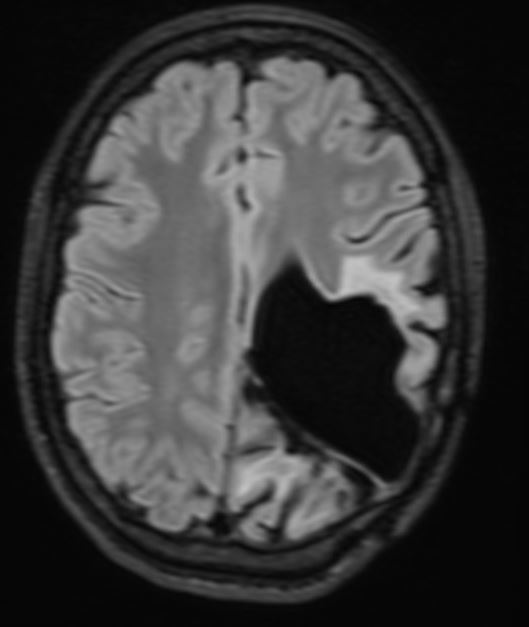
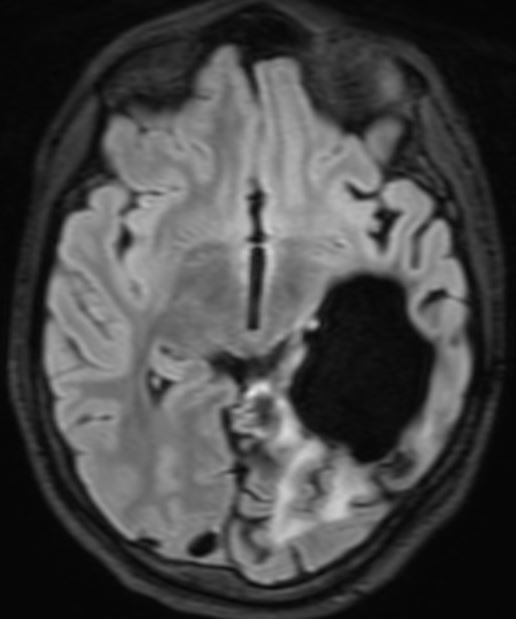
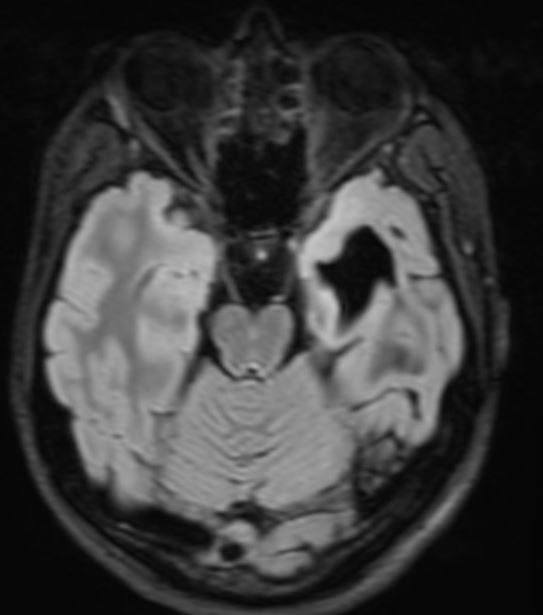
The patient presented with headache and vomiting and subsequently had surgery on three occasions for an intraventricular meningioma, with the following sequelae on MRI scan